North Korea’s Foreign Trade
Foreign trade is, like elsewhere and for obvious reasons, one of the key indicators of North Korea’s economy. However, since the state is notoriously reluctant to provide related figures, we have to rely on external sources to obtain this data. The South Korean Trade-Investment Promotion Agency (KOTRA) is one institution that has for many years collected data on trade with North Korea from Pyongyang’s trading partners. Through this approach, called reverse statistics, KOTRA is able to produce one of the few macroeconomic datasets on North Korea that deserves at least a minimal degree of trust, even though there is still ample room for discussion regarding its completeness. At the end of September 2015, KOTRA published the latest of its reports on North Korea’s trade, including data for 2014.[1]
Main Findings
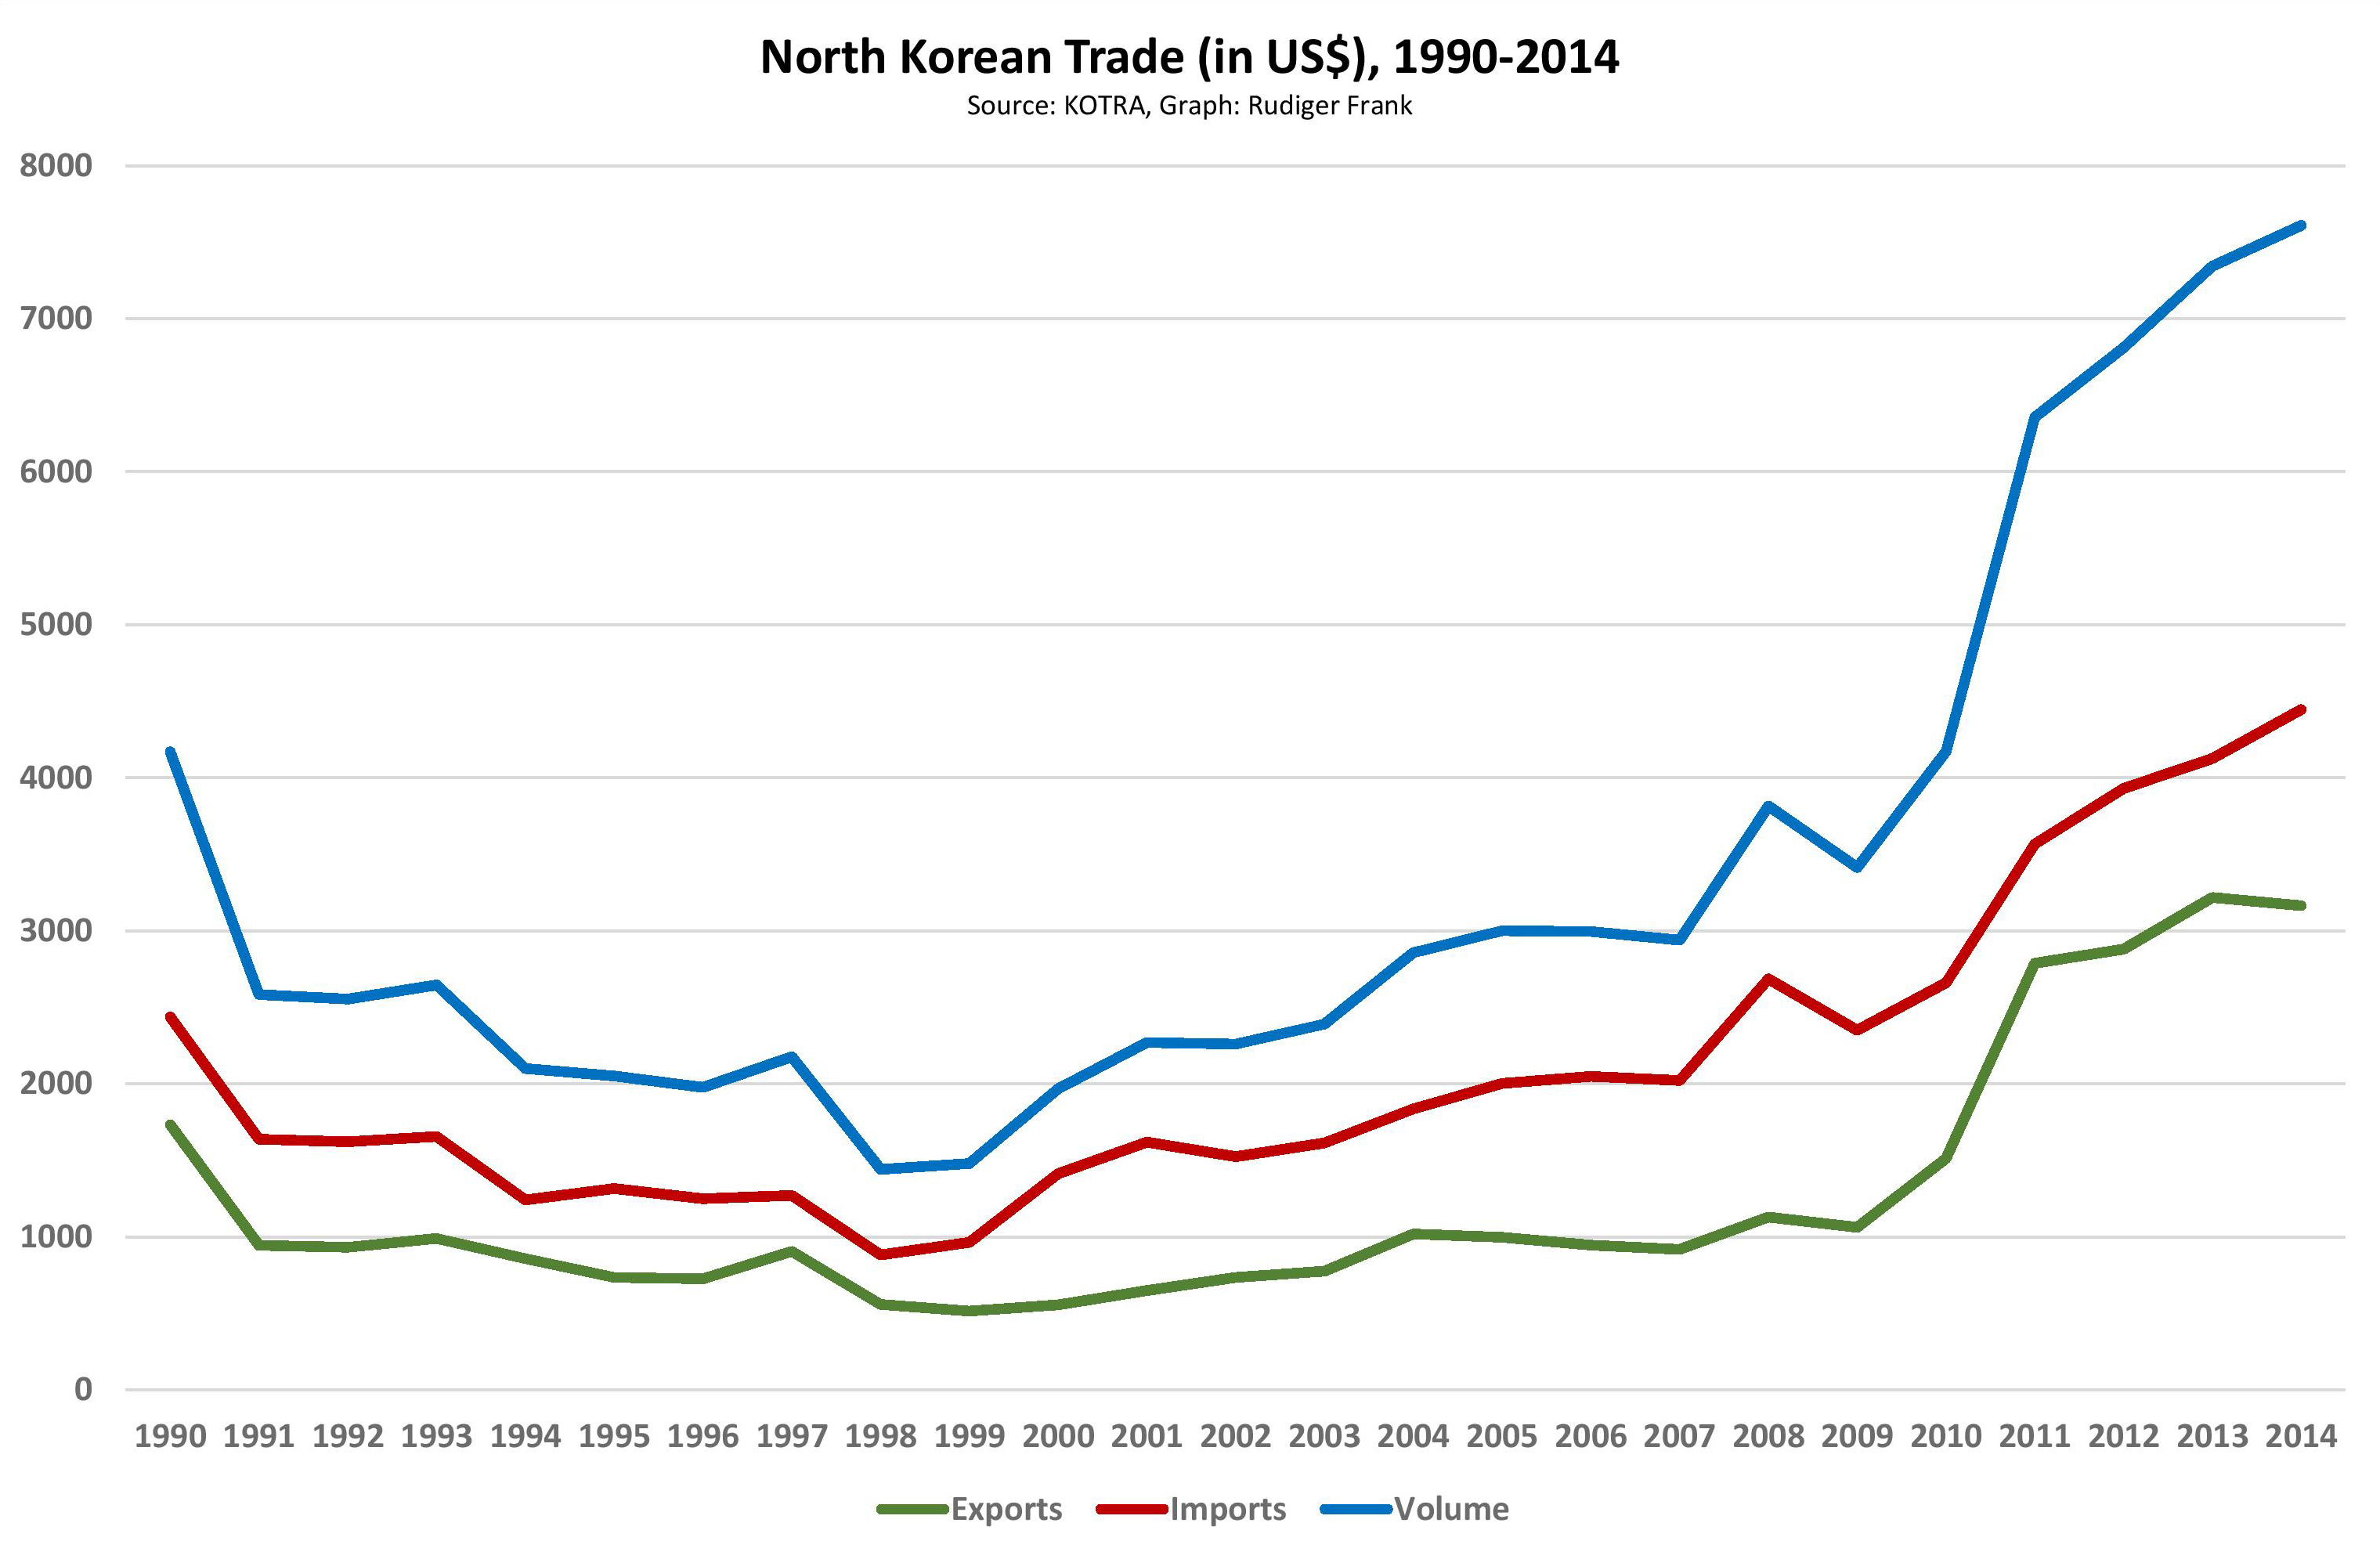
The most striking figure of the 2014 KOTRA report on North Korean trade is the trade volume (exports plus imports), which has grown by 3.6 percent over 2013 and reached $7.6 billion (US), the highest value since the end of the preferential trade agreements with the socialist bloc in 1990. The rate of growth was slower than a year before, but happened despite the third nuclear test that took place in February 2013. By contrast, in 2009, the year of the second nuclear test, North Korea’s trade had fallen by 10.5 percent.
While the overall trade volume has expanded, North Korea’s exports in 2014 actually declined slightly compared to the previous year by $154 million, from $3.218 billion to $3.164 billion. This can be explained by a reduction in the exports of anthracite, which dropped by $261 million from $1.439 billion to $1.178 billion. The reasons for this decline could have been lower world market prices, a lower production volume or a higher domestic use of coal. The latter would be a positive sign, because it implies more economic activity in North Korea.[2]
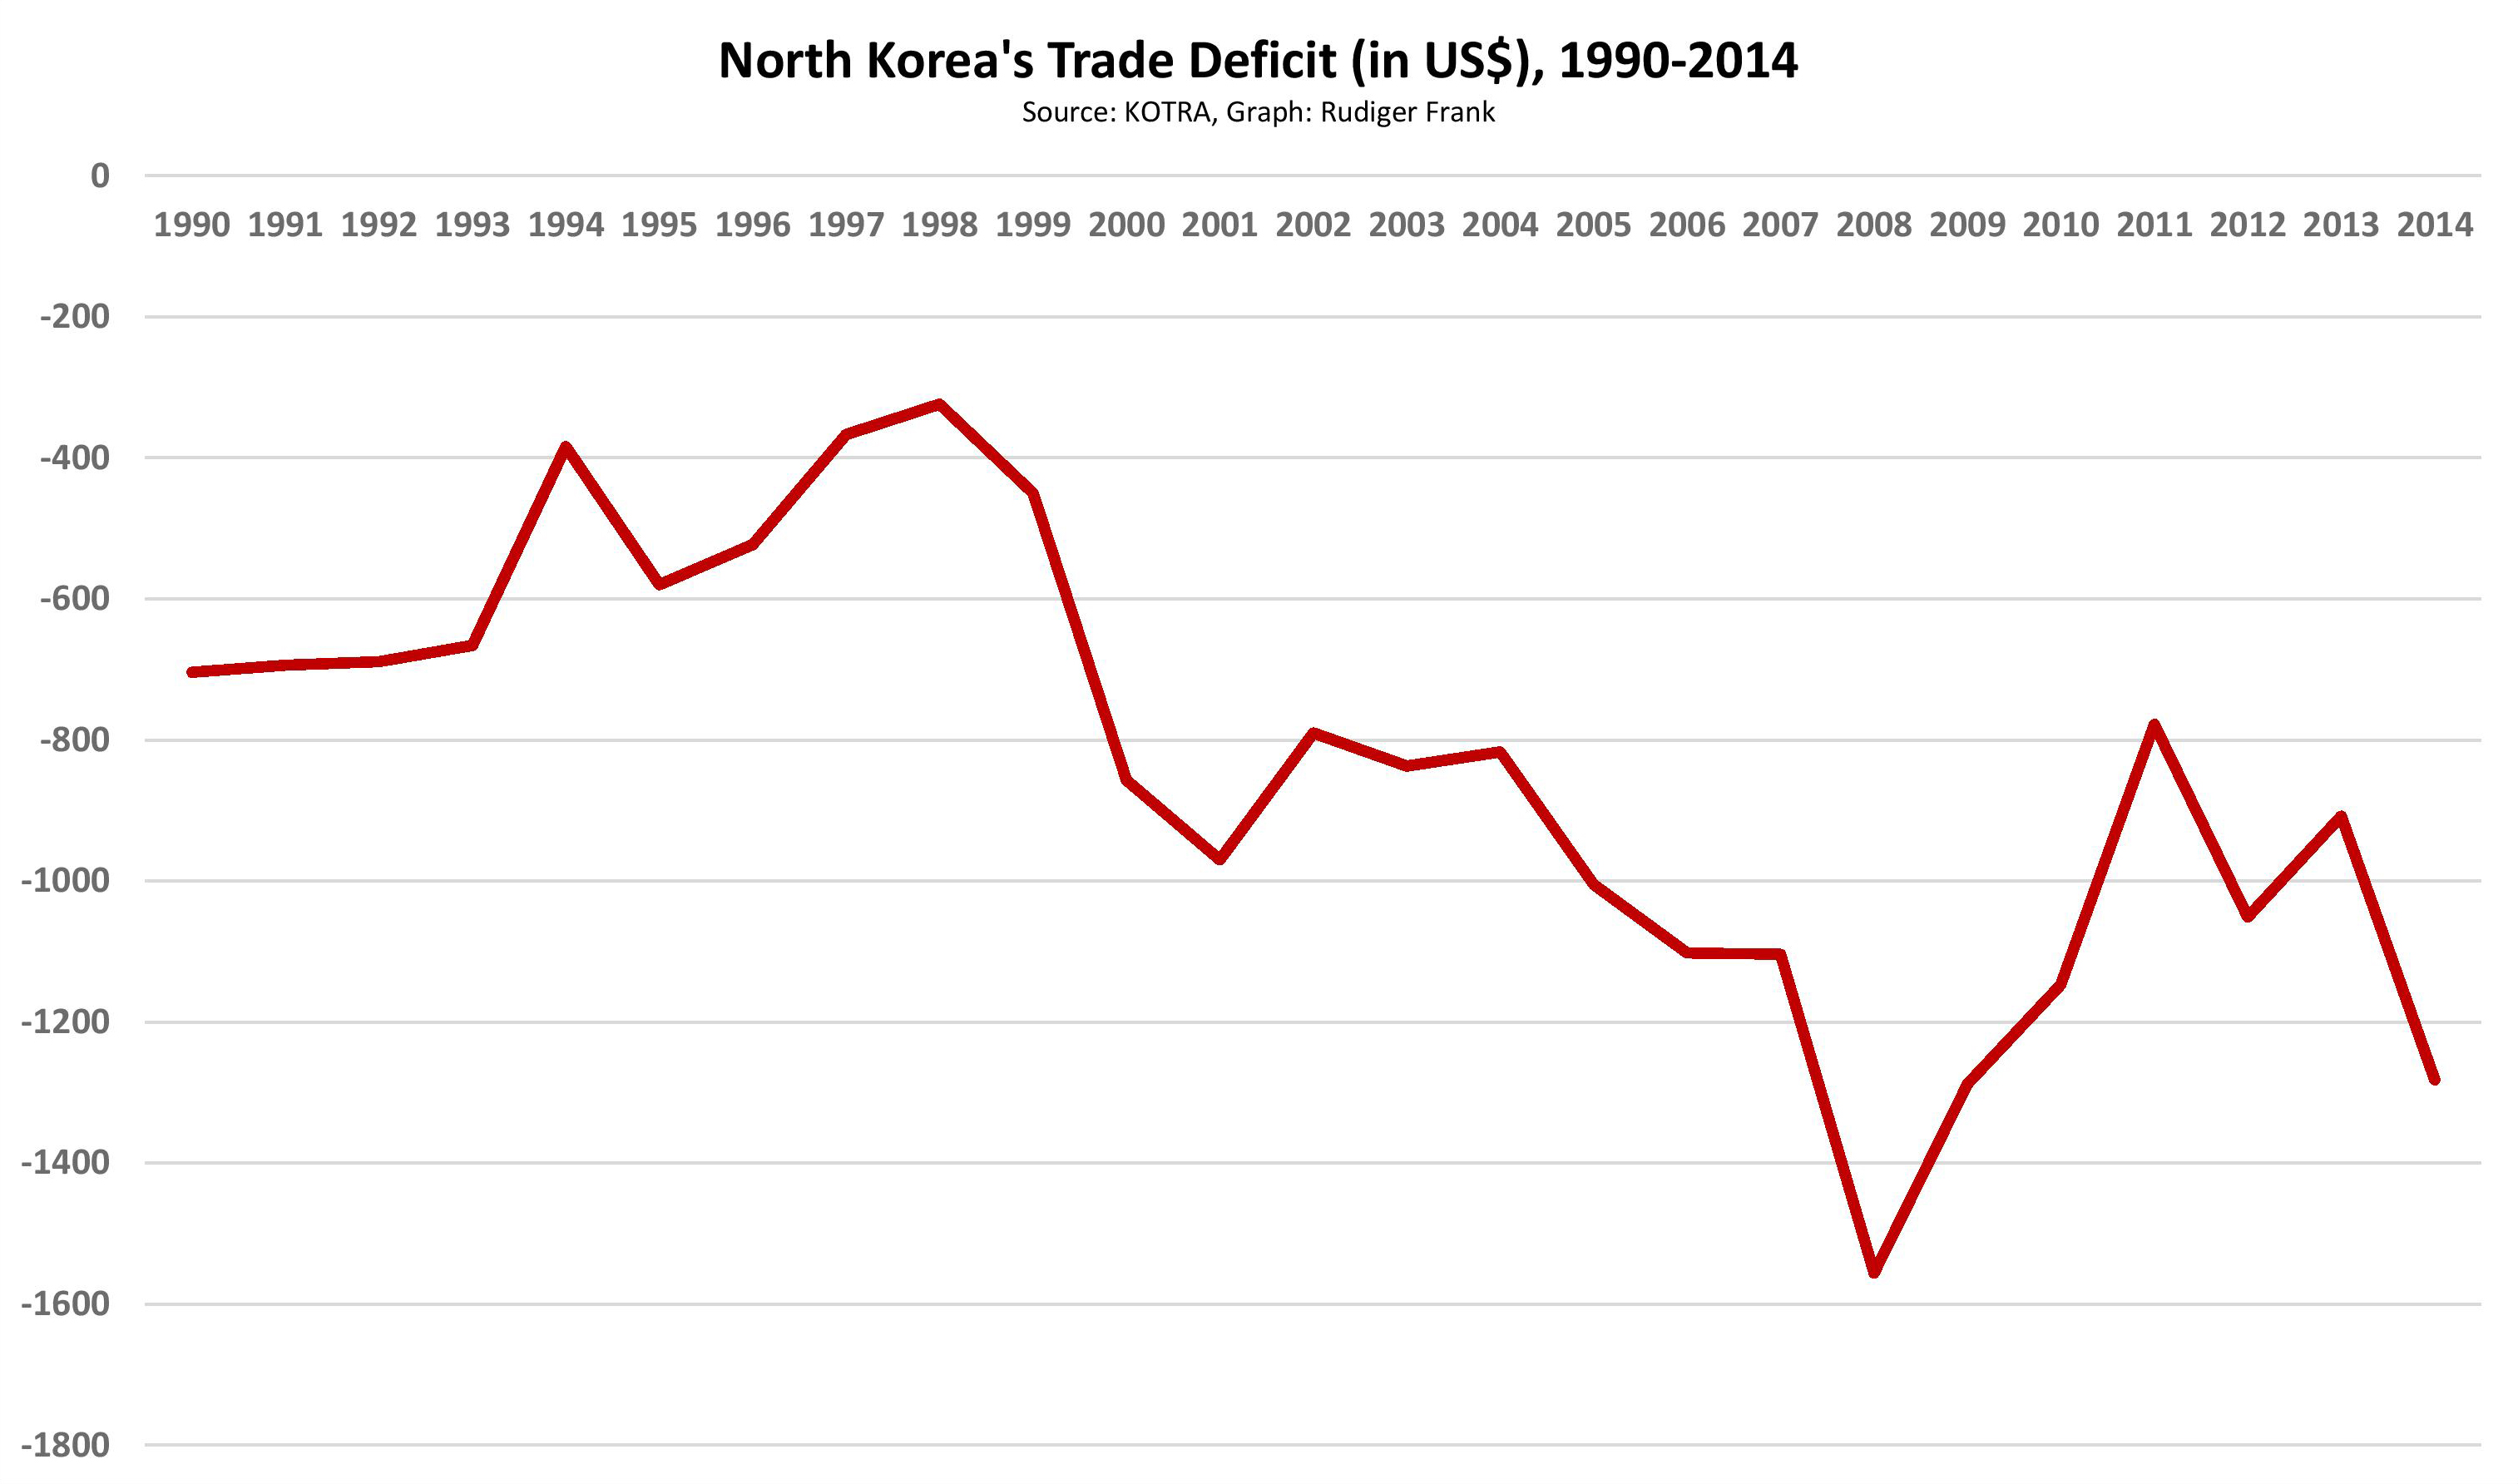
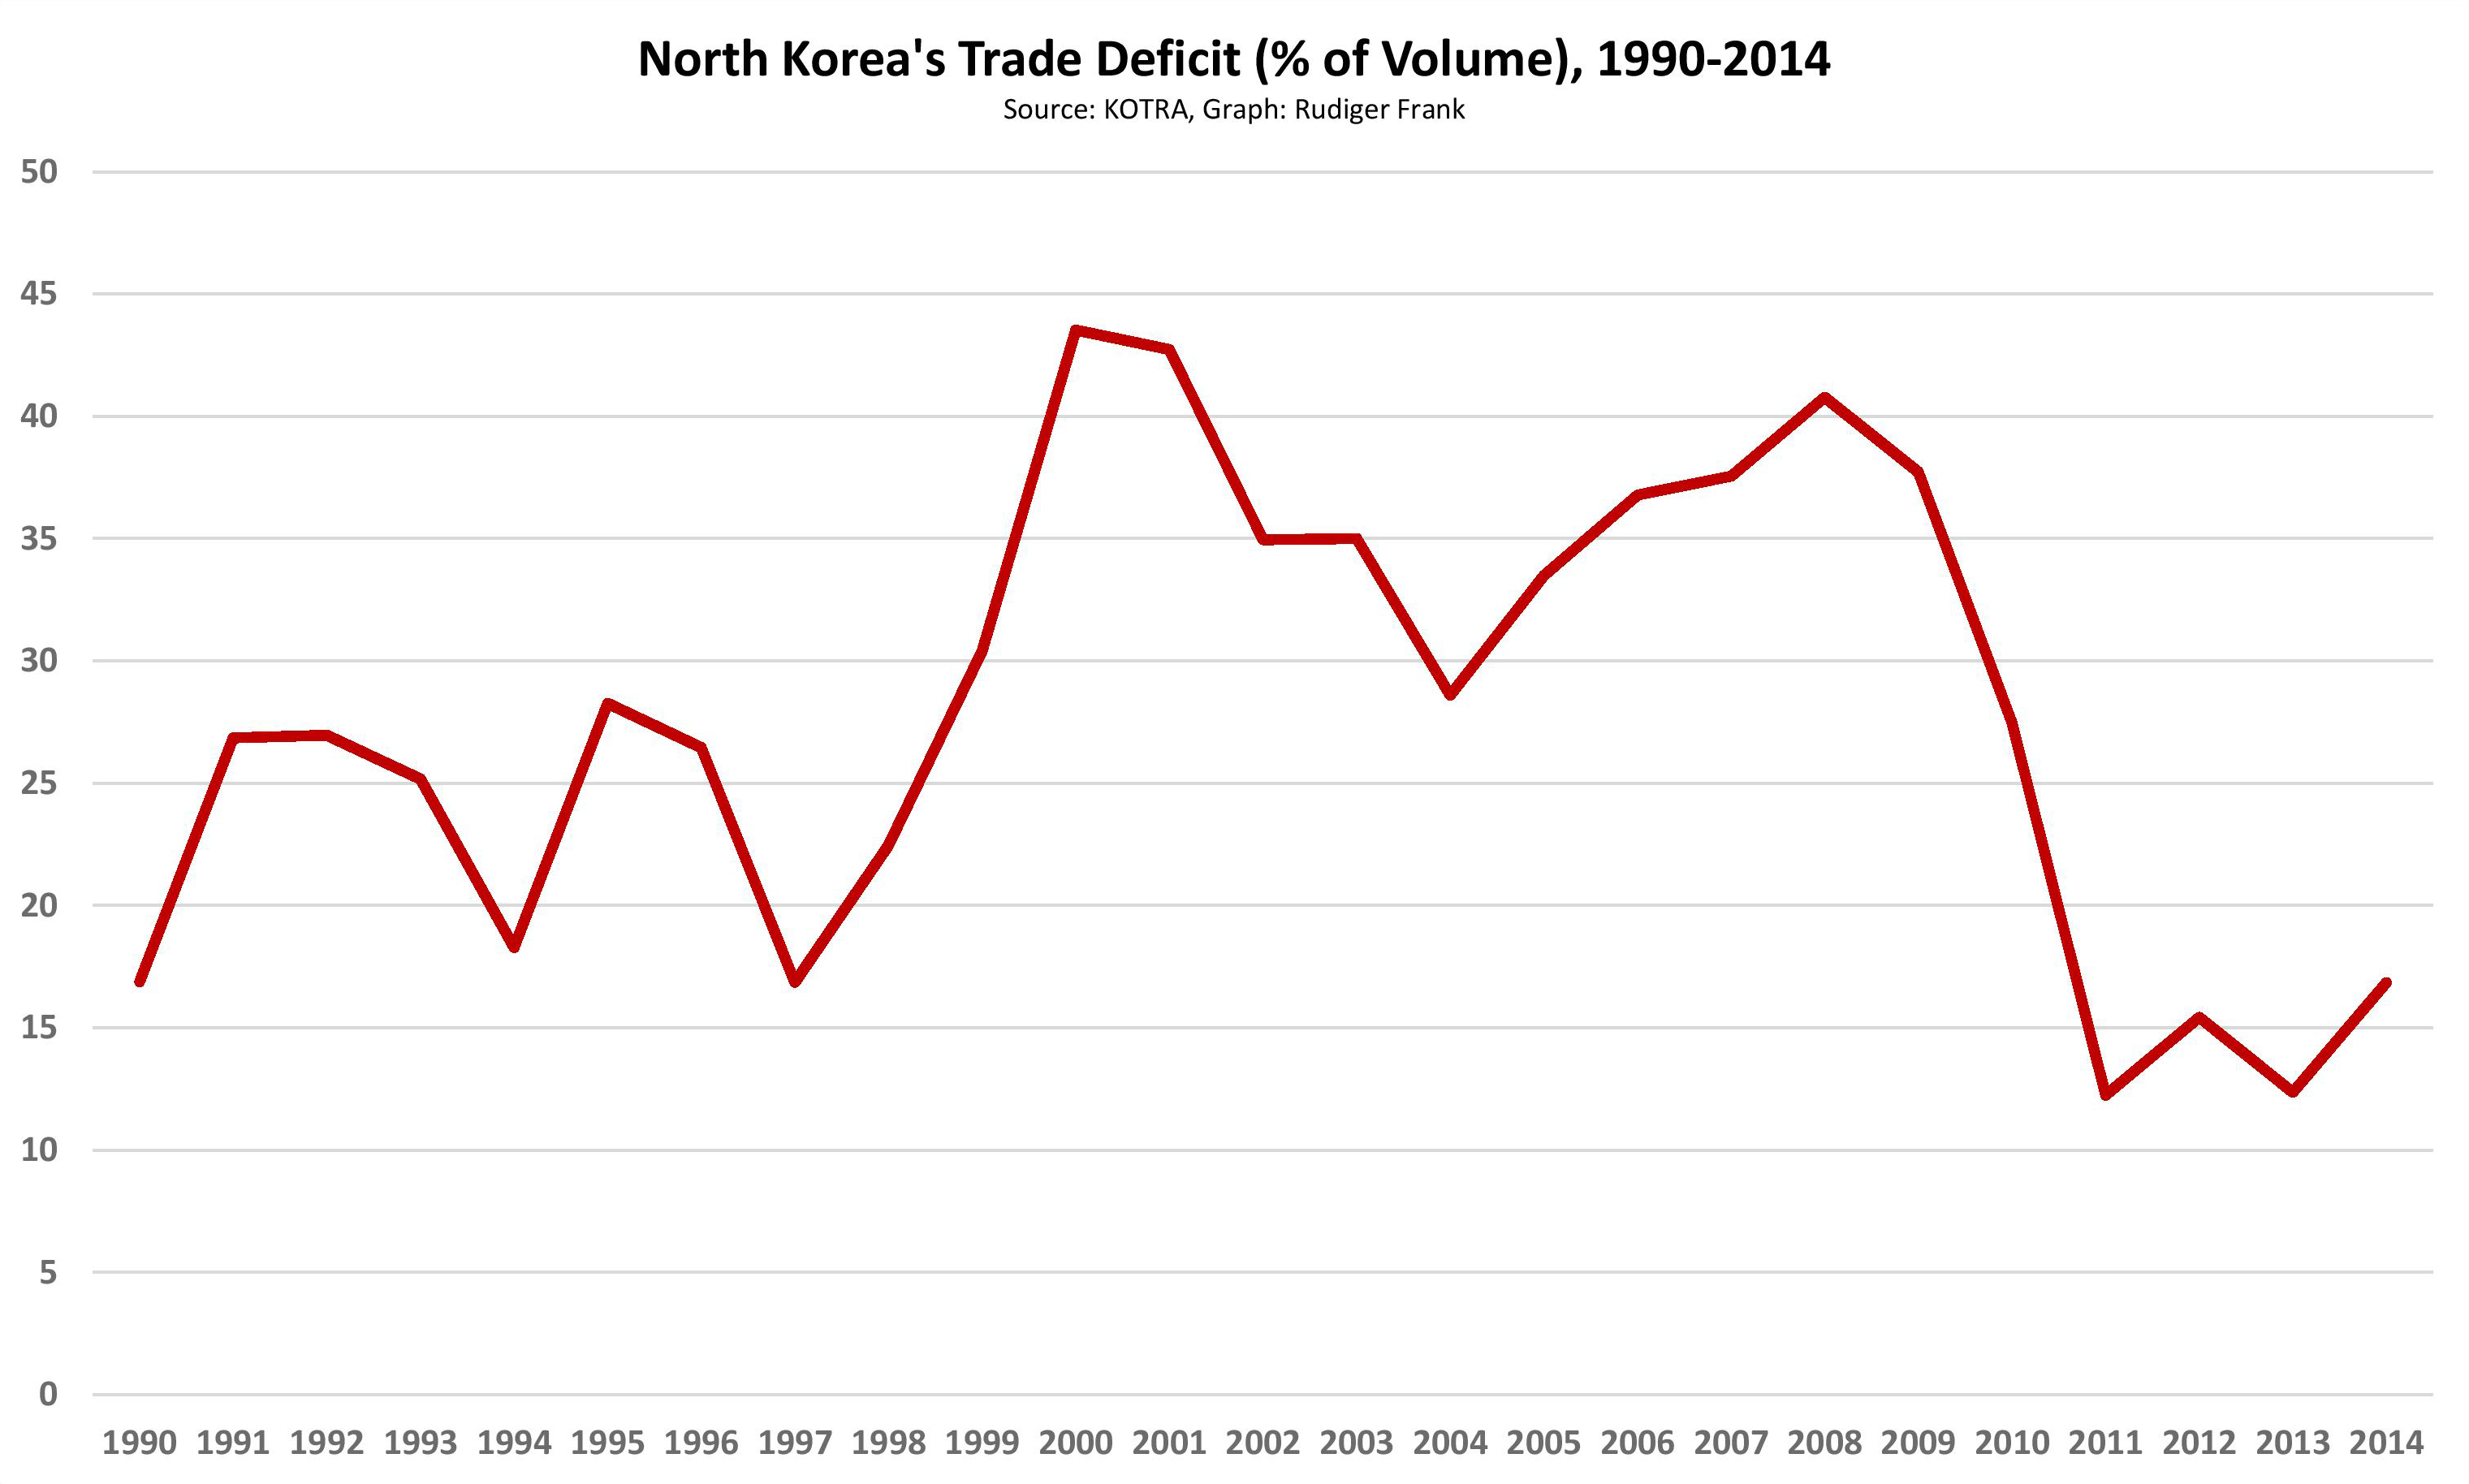
As every year, North Korea’s imports in 2014 exceeded its exports—by far. The gap is almost $1.3 billion. While this is not a small amount, a closer look at the numbers shows that the deficit has been bigger before, most notably in 2008. More importantly, in relative terms, the deficit has been declining; it reached about 17 percent in 2014 which is the fourth lowest percentage since 1990.
The very fact that North Korea can have a structural trade deficit of that size remains odd. The country does not have a convertible currency and has virtually no legal access to international finance. It thus has no chance to cover a trade deficit with debt. Still, North Korea is obviously able to buy more than it officially sells.
There is only one possible solution to this puzzle: North Korea must have other sources of income in addition to the exports listed by KOTRA. Such income can be political capital, which compels a major trading partner to deliver goods for free or, as this would typically be the case, to grant a long-term loan at no interest. “Invisible” income can also be generated from trade that partners usually are reluctant to report—arms trade, for example. In addition, gold could be used for direct payment. There is also trade that generates funds but does not show up in any statistics, like smuggling. Transfers or remittances are another typical source of income; foreigners or North Koreans living and working abroad remit funds back home that enter the state’s financial system. This also applies to fees that the state receives for sending laborers abroad.
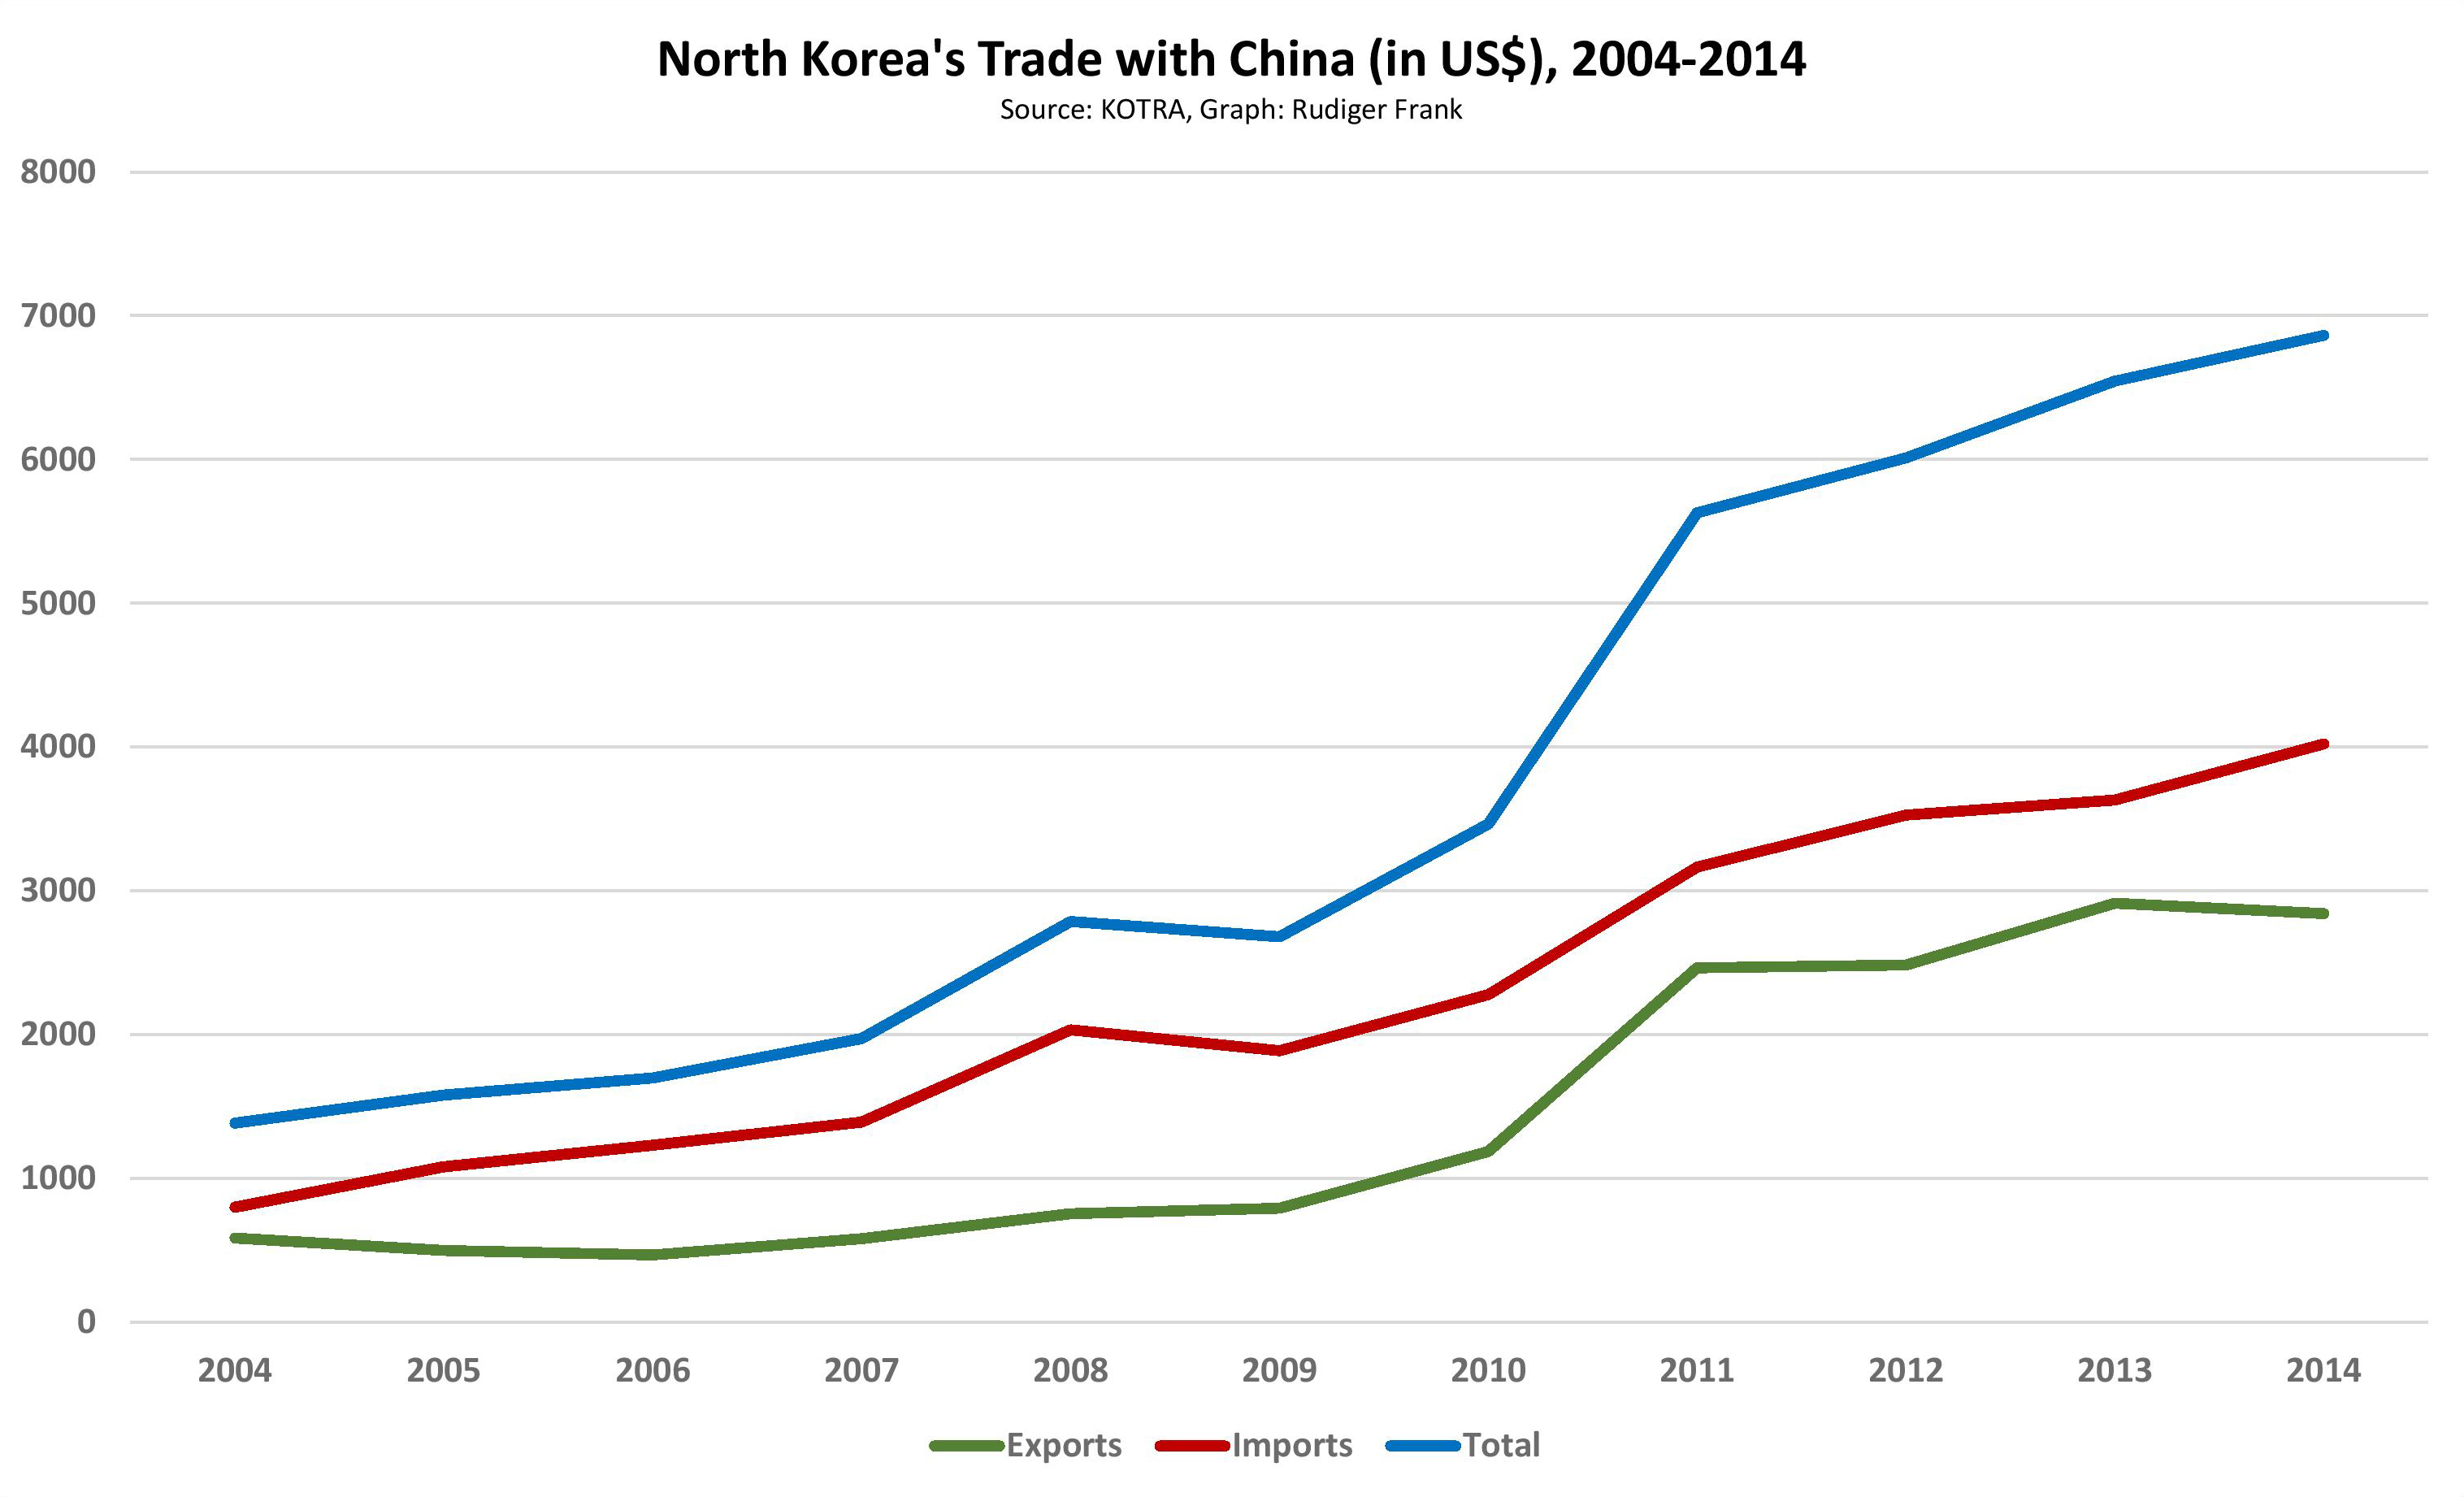
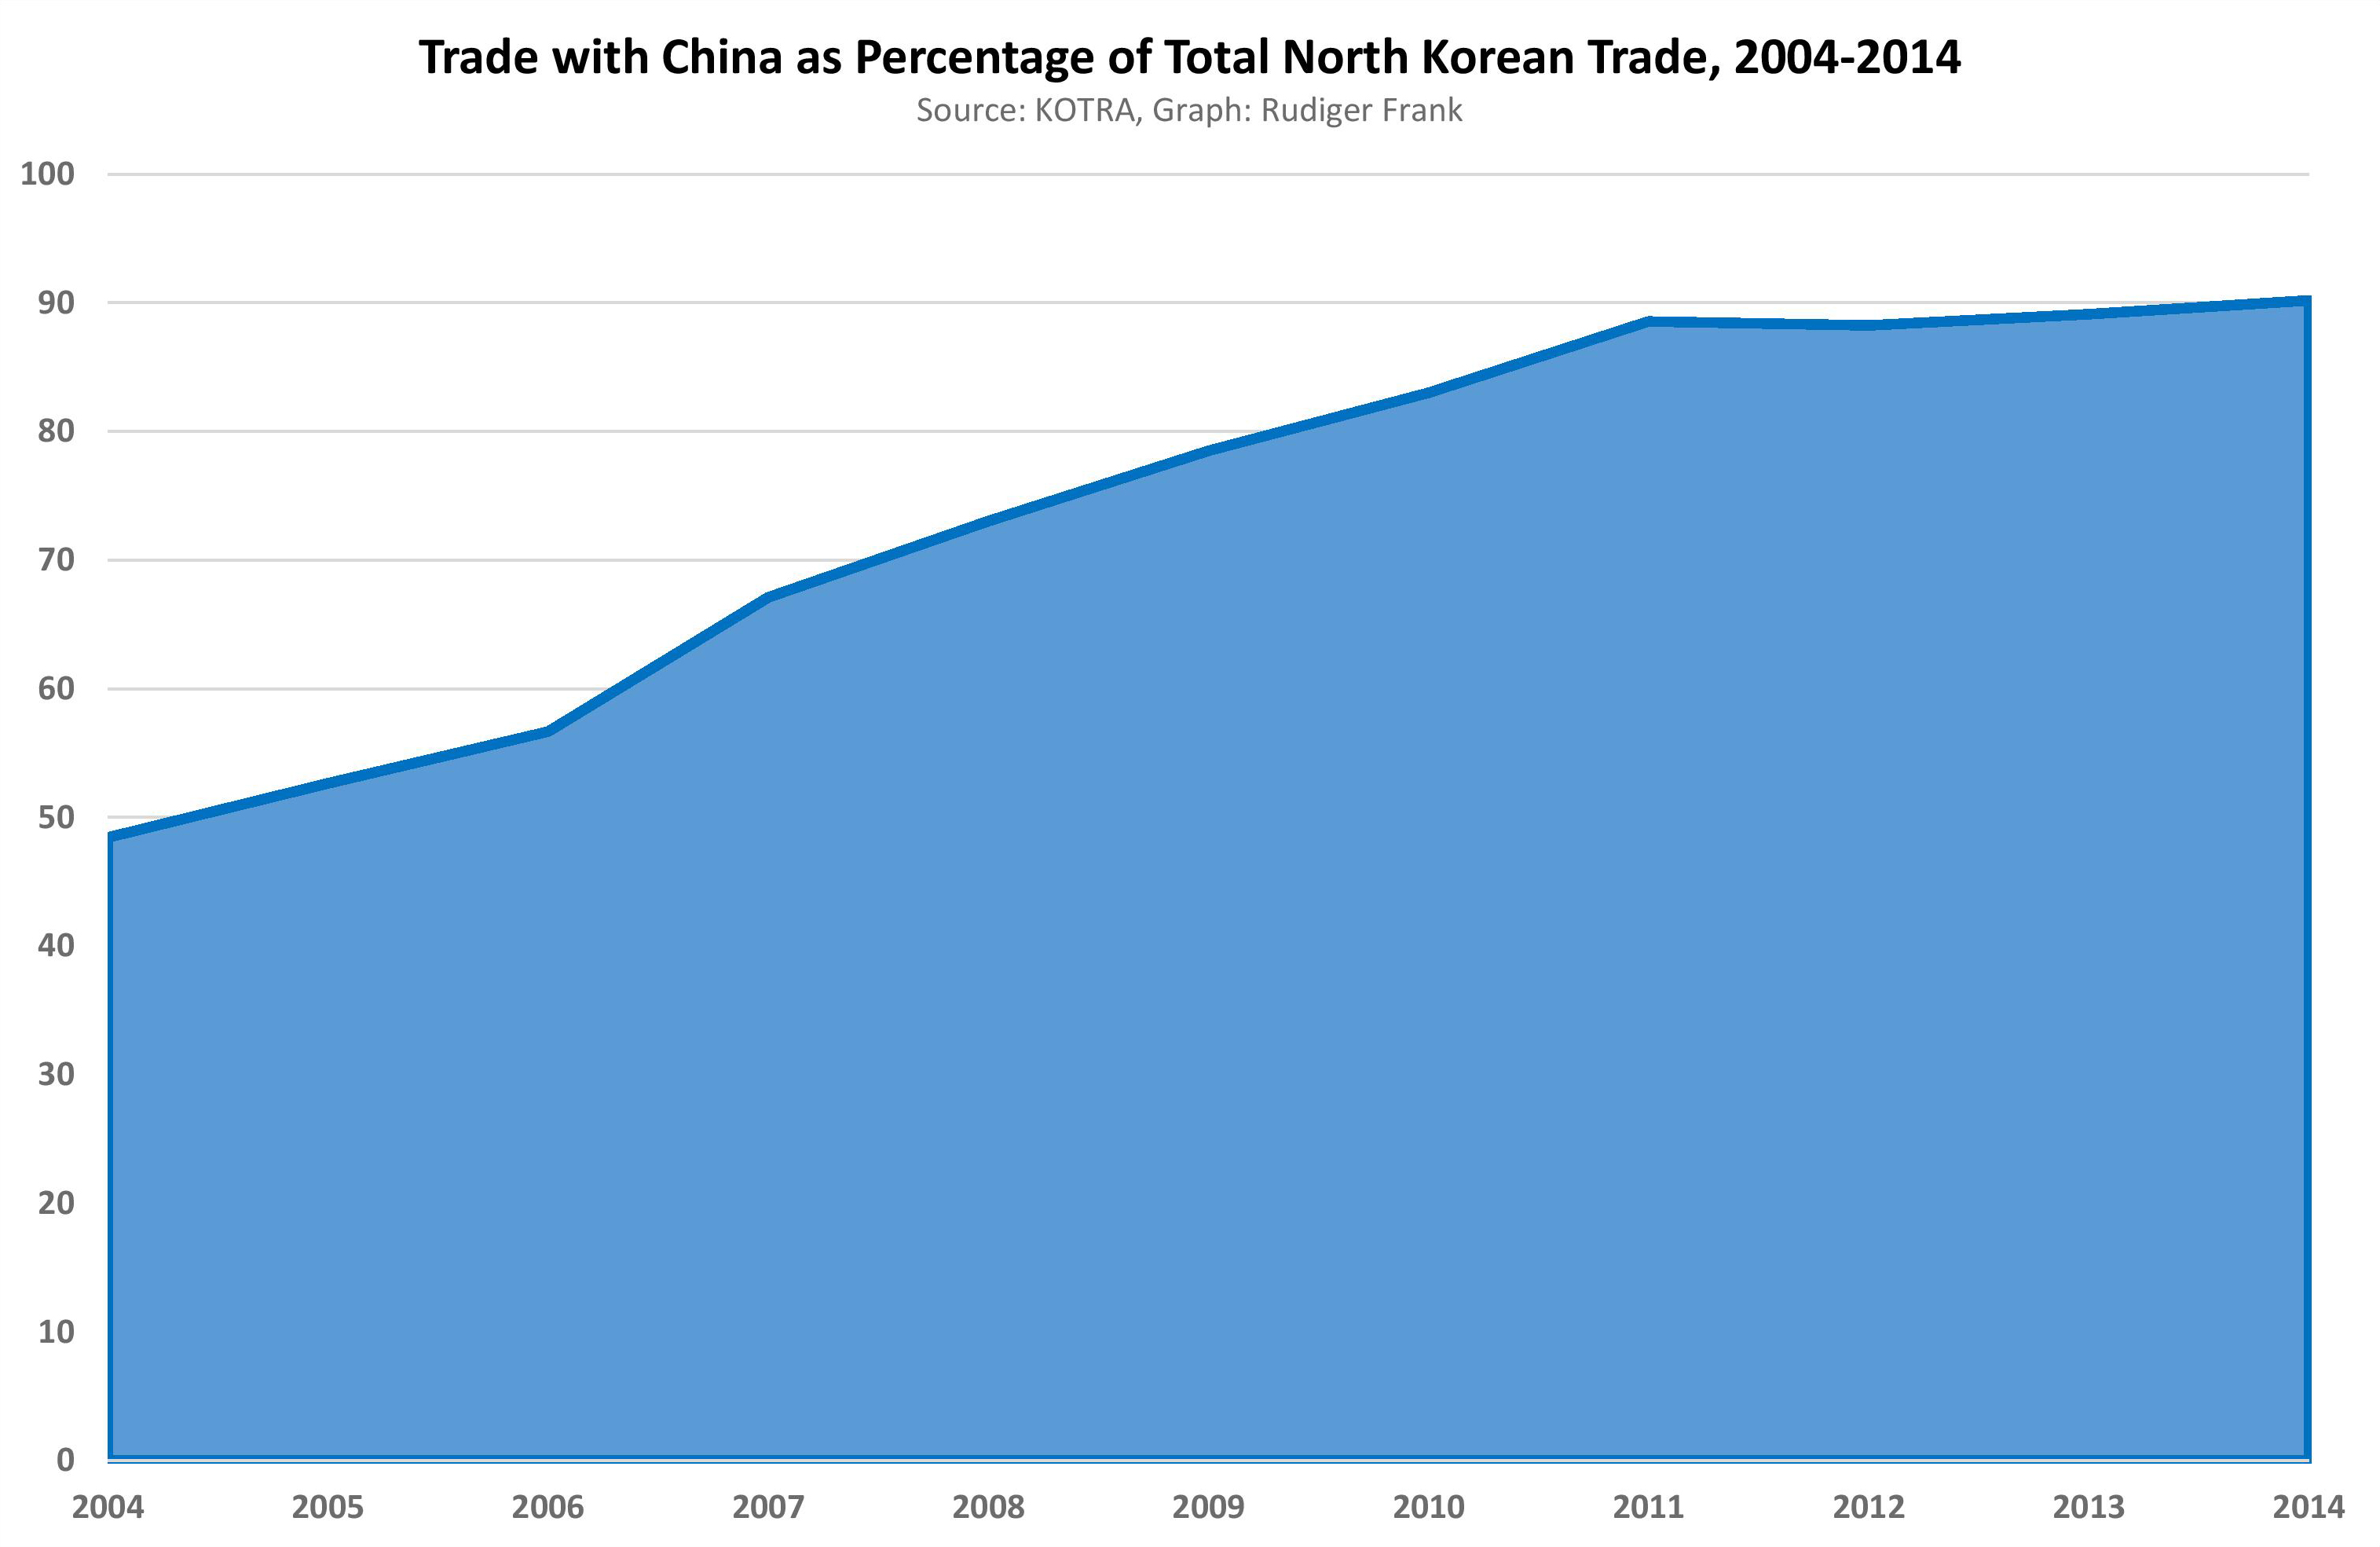
The third remarkable feature of North Korea’s trade is its massive dependency on China. This is a relatively recent phenomenon, since only ten years ago, China accounted for less than half of North Korea’s trade. Until 2002, Japan was North Korea’s major trading partner. However, this changed after the failed attempt to resolve the abductee issue in a summit meeting between Kim Jong Il and Koizumi Junichiro in September 2002. Trade with the rest of the Western world was heavily affected by the sanctions following the outbreak of the second nuclear crisis in October 2002, which needs to be understood in the context of the US “war on terrorism” after 9/11. This left a vacuum for China to fill, which at the same time, was pushing for economic development of its hitherto neglected northeastern provinces. In 2014, not less than 90.2 percent of all North Korean trade was with its big neighbor. That is yet another increase over the 89.1 percent rate in 2013, despite media reports about a worsened relationship between Beijing and Pyongyang after the North’s third nuclear test that February, the death of Jang Song Thaek that December and the allegedly bad chemistry between the young leader Kim Jong Un and China’s Xi Jinping. The attempts of the North Korean leadership to diversify its trade and the recently improved economic relationship with Russia do not seem to have had much of an effect on China’s trade dominance. In fact, the volume of trade with Russia even decreased slightly from $104 million in 2013 to $92 million in 2014, although we should be careful to derive trends from such small amounts.
Where Is Trade With South Korea?
The omission of inter-Korean trade is one of the laudable features of the KOTRA report. This might be primarily an ideological decision, along the logic that if trade with North Korea is treated as foreign trade, this would constitute a de facto recognition of that country as an independent state—which South Korea refuses to do. But no matter what the reasons are, excluding inter-Korean trade makes good economic sense. Why?
Because since the halt in inter-Korean economic activity under the South Korea’s May 24th Measures, the only noteworthy economic exchange between North and South Korea these days takes place at the Kaesong Industrial Complex (KIC). South Korea sends semi-finished products and raw materials to companies operating in the KIC; these count as North Korean “imports.” They are then processed in the KIC by 124 South Korean companies using North Korean labor. The processed goods are sent back to South Korea and recorded as North Korean “exports.” Technically, it is hard to deny that this is trade. But in fact, South Korea is mainly trading with itself. This case reminds us to be careful with numbers unless we understand where they come from, otherwise we might be misled to believe that the two Koreas have a brisk exchange of various locally produced goods and services in the range of $1 billion annually, which is just not the case. All that happens is that roughly $100 million per year is transferred from South to North, in the form of wages for the 54,000 female workers in the KIC.[3] But not a single South Korean product makes it to the North Korean market (well, not this way at least), and neither is this the case for North Korean products in the Southern market. This should be considered when reading headlines about the Kaesong Industrial Complex having reached an accumulated production volume of $3 billion in early October 2015.[4]
Why Is North Korean Trade Relevant?
One reason why it is important to know about North Korea’s trade is that it serves as an indicator of the status of the country’s economy—on which we have almost no other reliable macroeconomic data. Whether for humanitarian reasons or in order to know how receptive Pyongyang’s diplomats might be to economic incentives, we need to be able to feel the pulse of the economy.
Remember that the famine of the mid-1990s was accompanied, or even triggered, by the collapse of a foreign trade structure that was geared towards politically motivated exchange with allies from the so-called socialist bloc. Total trade dropped from about $4.1 billion in 1990 to $2.6 billion only a year later, and kept decreasing until it reached its lowest point in 1998 with a mere $1.4 billion (see graph 1). Imports of fertilizer and fuel almost stopped in the early 1990s; electricity became even scarcer. The combination of inadequate crucial inputs for agricultural production, two consecutive natural disasters, and the typical low efficiency of state-socialist agriculture led to a sudden drop in output. Lack of hard currency, or the leadership’s lack of willingness to use what little was available for that purpose, meant that no food would be imported. The resulting famine cost countless lives.
A repetition of such a catastrophe would be disastrous and thus needs to be avoided by all means. In addition to the human dimension, this time North Korea is a state equipped with nuclear weapons of unknown quality and quantity. Considering the changes in society during the last two decades and the new leadership, it is very unlikely that another major food crisis would leave domestic political stability unaffected. Given the difficulties assessing the actual macroeconomic situation by regular means, trade would function as an early warning indicator of a worsening economy and of a potentially multiplying security threat.
Furthermore, trade tells us something about the effectiveness of sanctions. If a country that is subject to continuous and actually growing restrictions on its external economic relations nevertheless experiences a growing trade volume, then the imposed sanctions obviously do not work as intended and need to be rethought.[5]
Not least, and to end on a somewhat happier note, expanding trade implies more economic activity. This includes more people-to-people exchanges, more learning by doing, more day-to-day business, perhaps more corruption, and certainly more purchasing power on the markets. The latter have come a long way from occasional gatherings of makeshift stalls on a dusty place at some intersection.[6] Some of them seem to have become more professional and permanent, as I could see during my last visit to Rason in September 2015. The old market there has now moved from the typical low-rise shed with its blue aluminum-roof into a complex of modern, two-story buildings complete with a parking lot and large, brightly illuminated shop windows. Needless to say, most products on sale there are from China.
_______________
[1] 2014년 북한의 대외무역동향, http://www.globalwindow.org/gw/krpinfo/GWKITR020M.html?BBS_ID=16&MENU_CD=M10403&UPPER_MENU_CD=M10401&MENU_STEP=2&ARTICLE_ID=5031941&ARTICLE_SE=20346.
[2] See, for example, Benjamin Katzeff Silberstein, “North Korea’s domestic impacts of lower coal prices,” North Korea Economy Watch, September 22, 2015, http://www.nkeconwatch.com/category/energy/coal.
[3] Kim Tae-shik, “Inter-Korean Exchange and Cooperation Since May 24 Measures,” Vantage Point, June 2015, 10-14.
[4] “Kaesong joint complex reaches US$3 bln in accumulated production volume, 11 yrs after opening,” Yonhap, April 10, 2015, http://english.yonhapnews.co.kr/national/2015/10/04/52/0301000000AEN20151004000400315F.html.
[5] For a more detailed discussion of sanctions on North Korea, see Rudiger Frank, “The Political Economy of Sanctions Against North Korea,” Asian Perspective, Vol 30, No. 3 (Fall, 2006) 5-36, also at http://japanfocus.org/data/frank.sanctions.pdf.
[6] For a satellite analysis of market expansion, see Benjamin Katzeff Silberstein, “Growth and Geography of Markets in North Korea,” US-Korea Institute at SAIS, October 2015, http://uskoreainstitute.org/wp-content/uploads/2015/10/USKI-New-Voices-BKS-Markets-Oct2015.pdf.