How Global Is the North Korean Economy?
 North Korea may be one of the most autarkic economies in the world, but it is far from isolated from global fluctuations. Market price data suggests that North Korea faces much more volatile fluctuations and often much more extreme price swings than those on international markets. At the same time, market prices in North Korea do tend to move in a relatively similar direction as global price trends most of the time, although sometimes in a delayed fashion. This demonstrates that while the North Korean economy is often guided by factors other than global markets, it is far from insulated and isolated from global economic trends.[1]
Global Food Prices
To understand how domestic food prices are impacted by international market swings, consider the graph below (Graph 1) that shows a comparison of rice prices in North Korea with global markets:
Graph 1. Rice prices, North Korea vs. global markets (USD/kg)
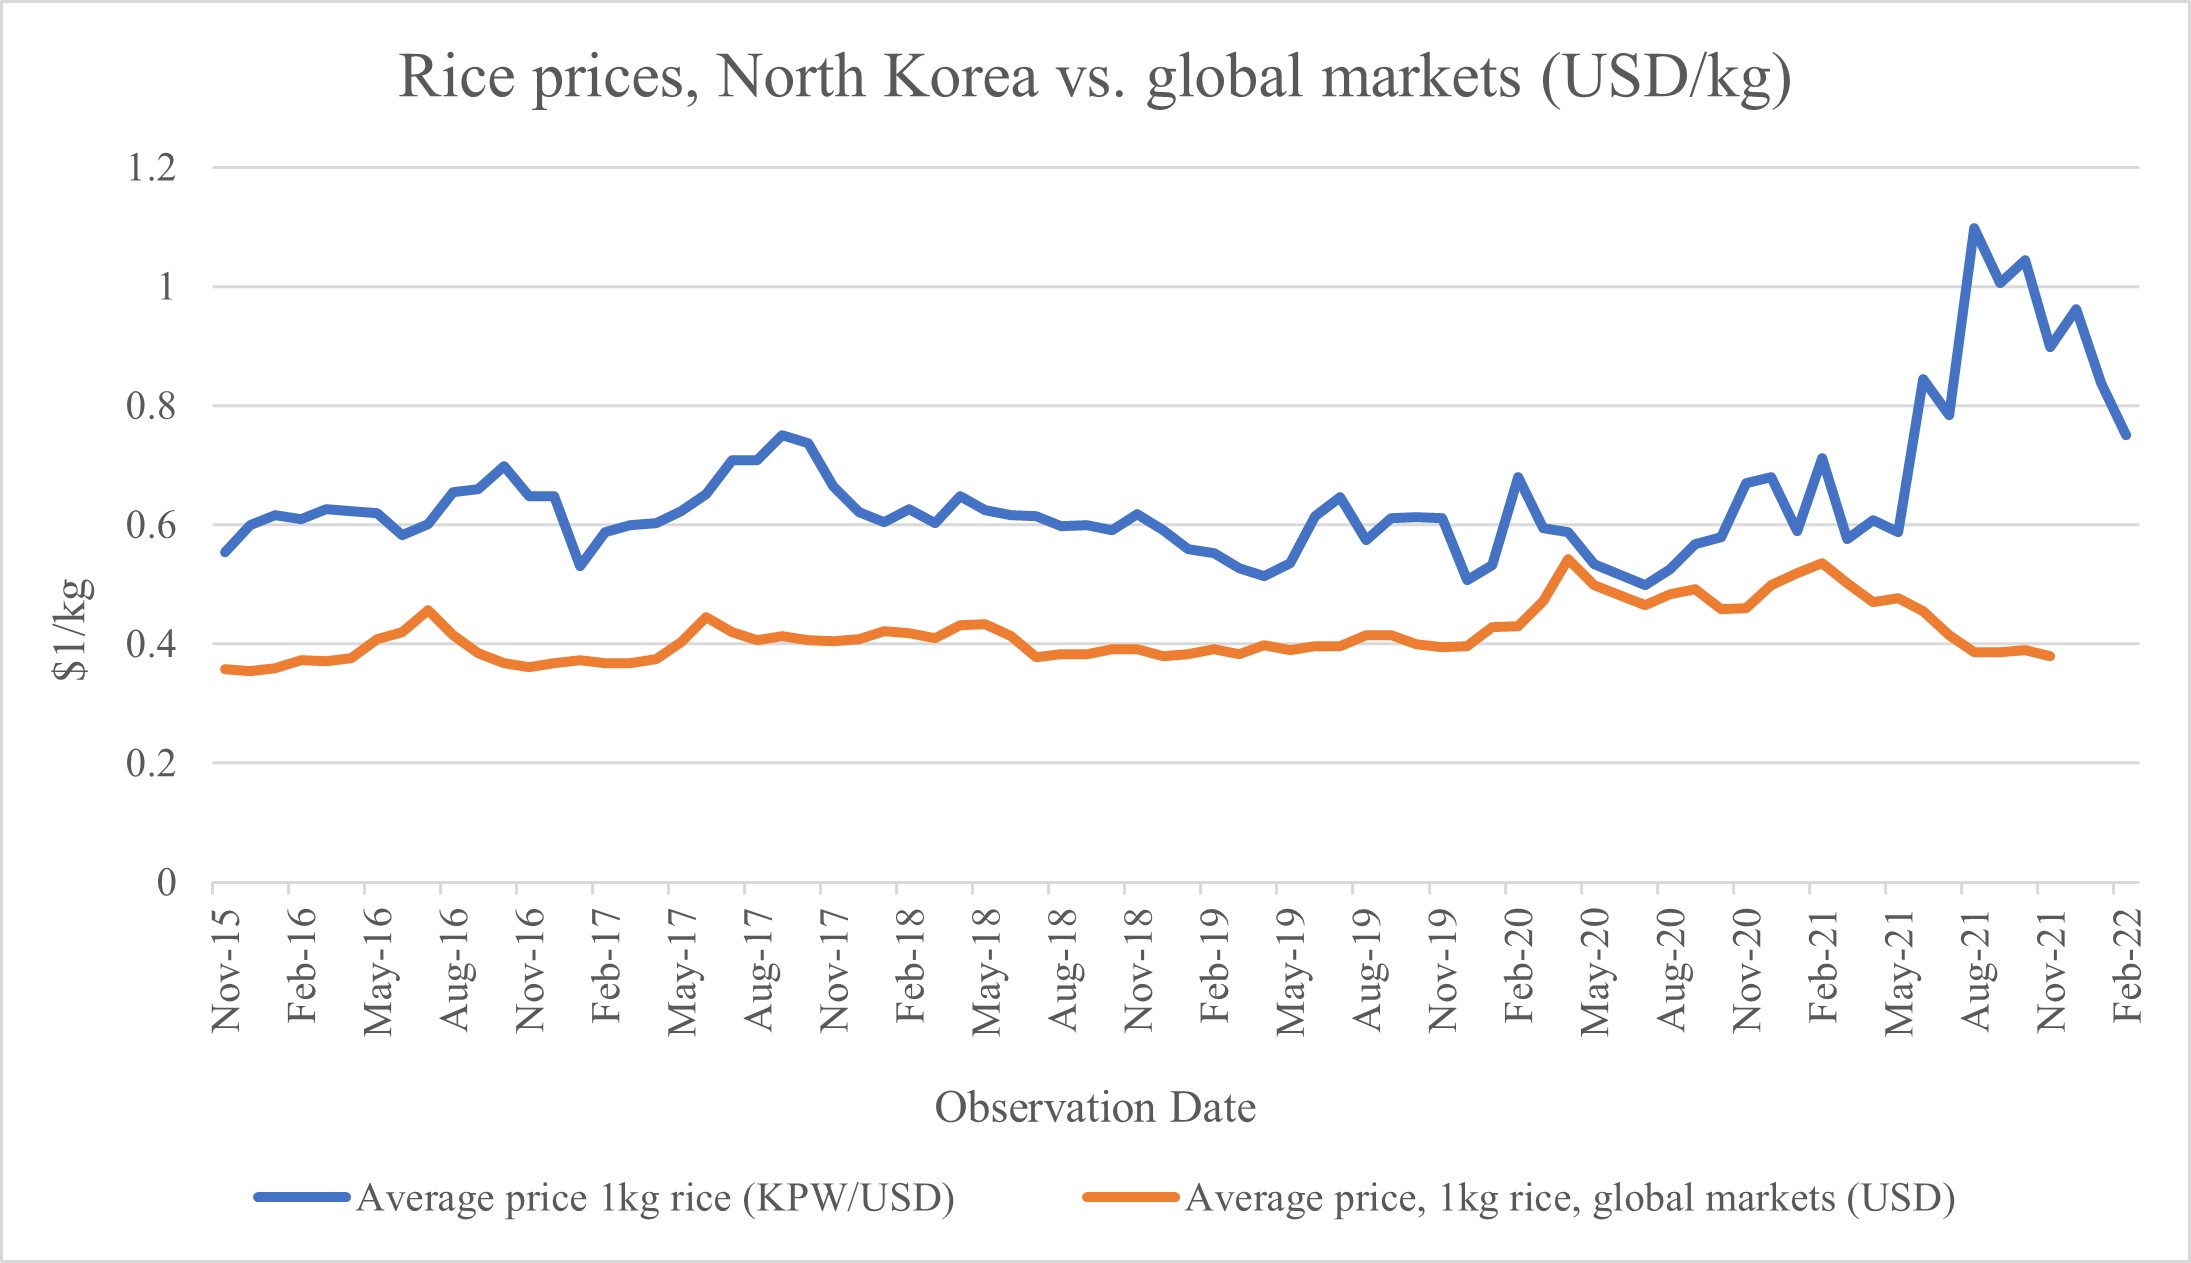
Rice prices in North Korea tend to move in tandem with global markets, but with some time variation. For example, global rice prices increased from 0.38 USD in April 2016 by 21 percent to 0.46 USD that July. North Korea similarly experienced a price rise of almost 21 percent around the same time but in a delayed manner. Prices began rising from 0.58 USD in June 2016 to 0.66 USD that September and plateaued at a total increase of 20.7 percent in October of that same year at 0.70 USD.
Prices also often fluctuate more strongly in North Korea. For example, global market prices rose from 0.36 USD in November 2016 by 22 percent to 0.44 USD in June 2017. North Korea experienced a similar price rise from 0.52 USD in January 2017 by twice the global increase at 44 percent to 0.75 USD that September.
Despite North Korea’s COVID-19 border closure, domestic rice prices have moved in conjunction with international ones. In July 2020, the global market price for 1 kg of rice was 0.46 USD, and the price in North Korea was very close at 0.50 USD. Until February 2021, prices rose on both global markets and in North Korea, but much more drastically in the latter. The global price increased by 17 percent to 0.54 USD, and North Korean prices went up by 42 percent to 0.71 USD.
The more drastic price swings are likely, at least in part, caused by a lack of information on North Korean markets. While price changes in North Korea are often more drastic, they tend to move in parallel with global market prices.
Graph 2. Percentage change in rice prices, North Korea vs. global markets.
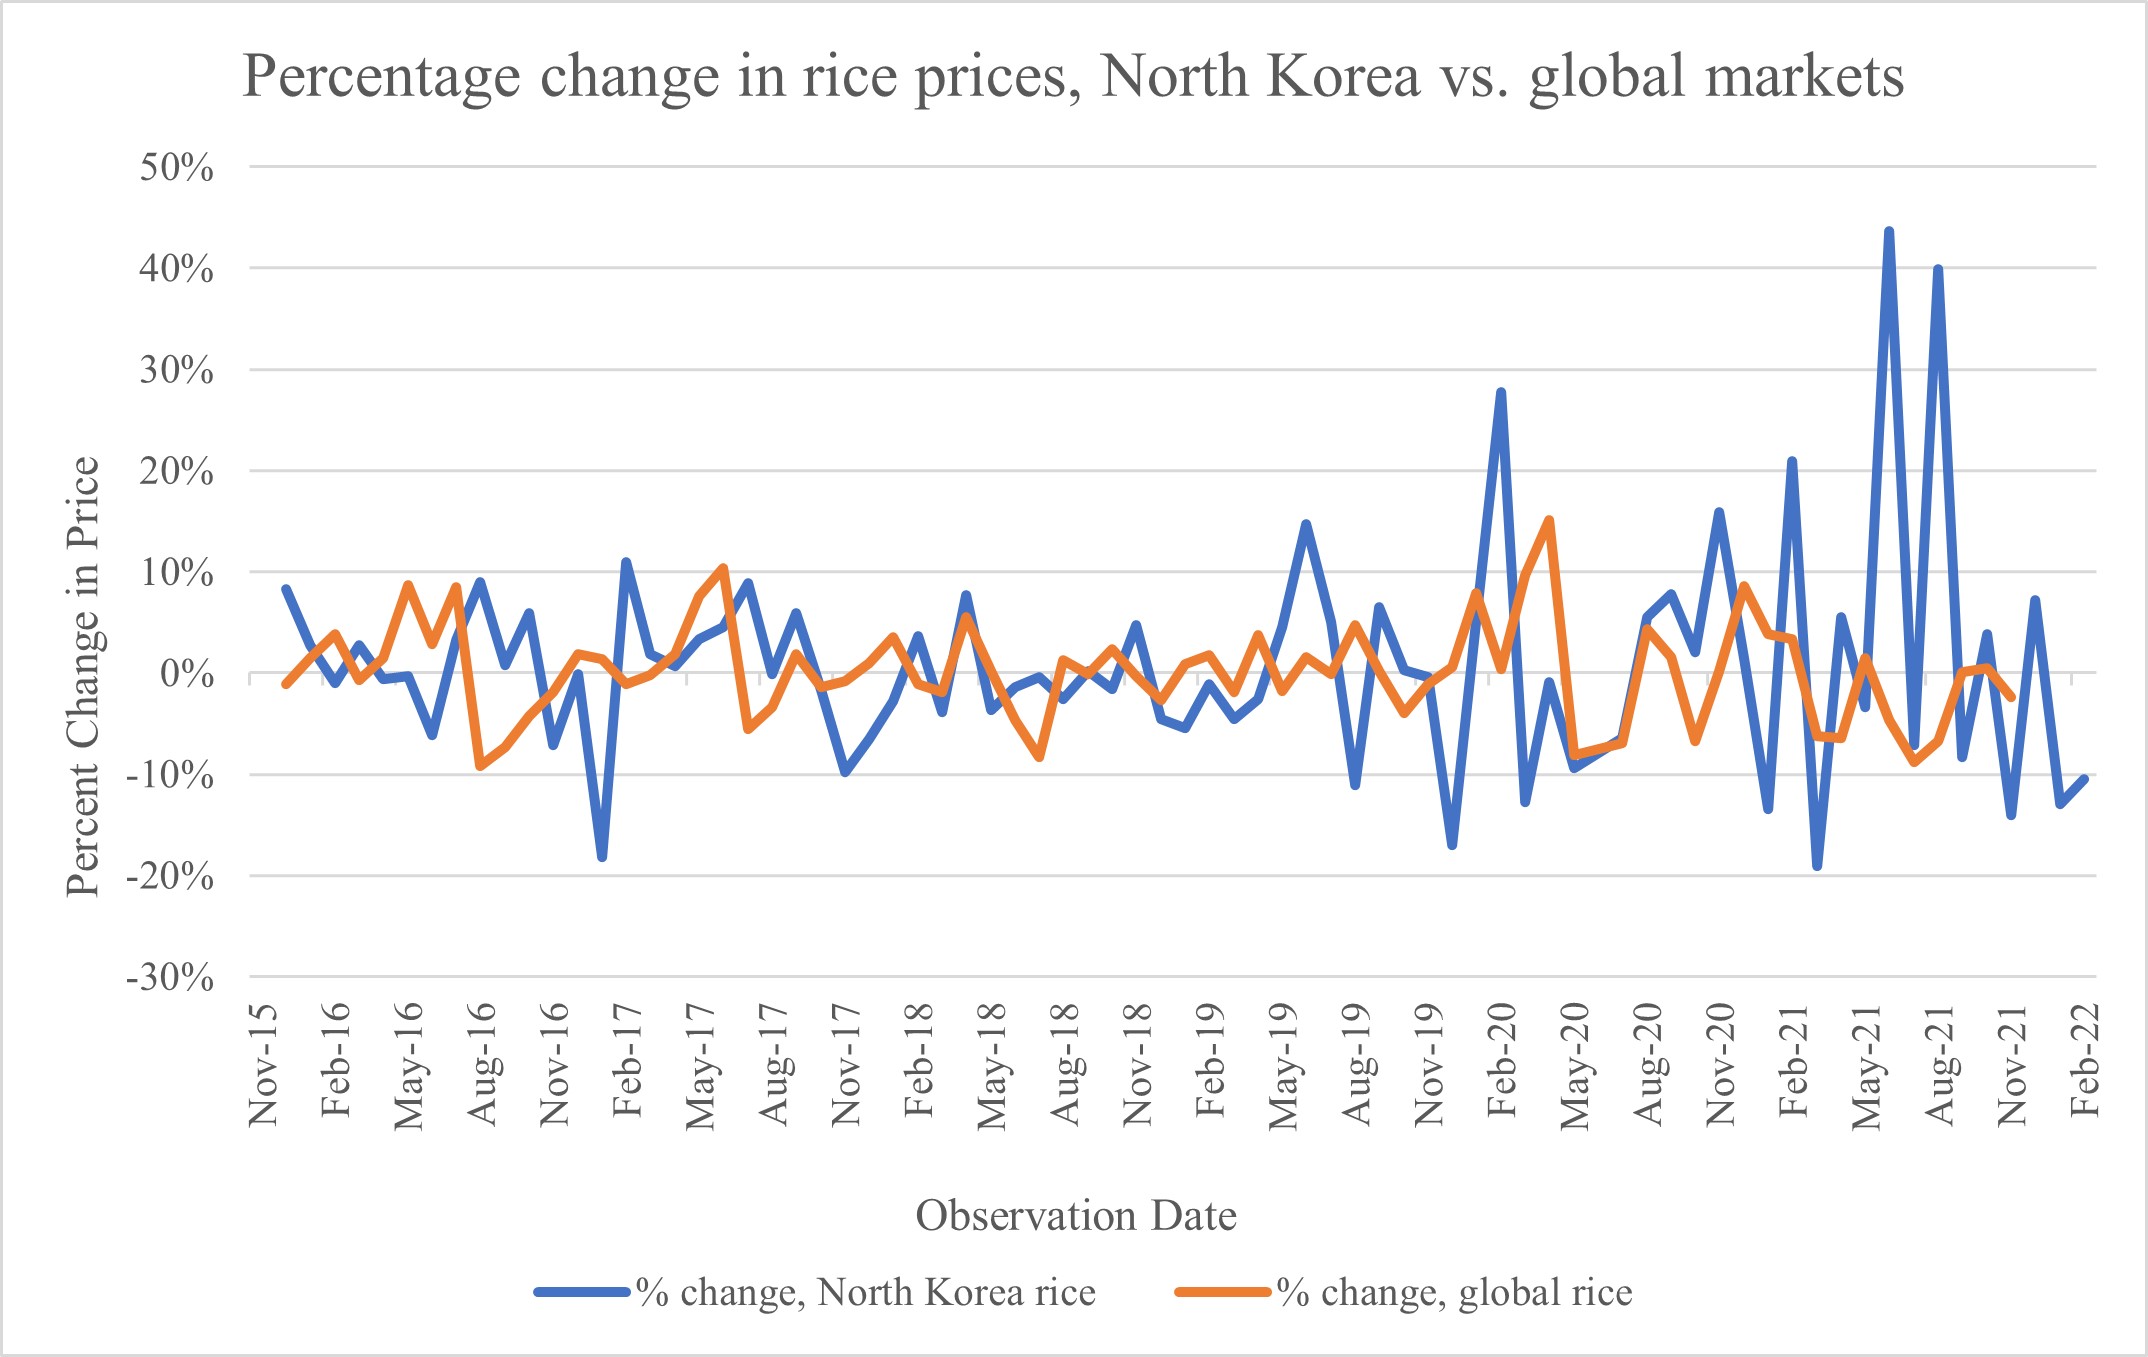
Information from the outside world about supply conditions takes longer to reach North Korea than other countries. Furthermore, poor infrastructure and communication inside the country means price information travels more slowly domestically. Thus, rice prices in North Korea may change more drastically to indications of lower supply or increased demand, leading to large temporary price spikes. As Graph 2 shows, for example, in January 2020, global prices increased by 7.94 percent. In the following month, prices in North Korea spiked by 27.74 percent. Global market prices rose again by 0.22 percent in November 2020, while they increased by 15.86 percent in North Korea. As prices are already consistently higher in North Korea, these fluctuations likely caused significant hardships.
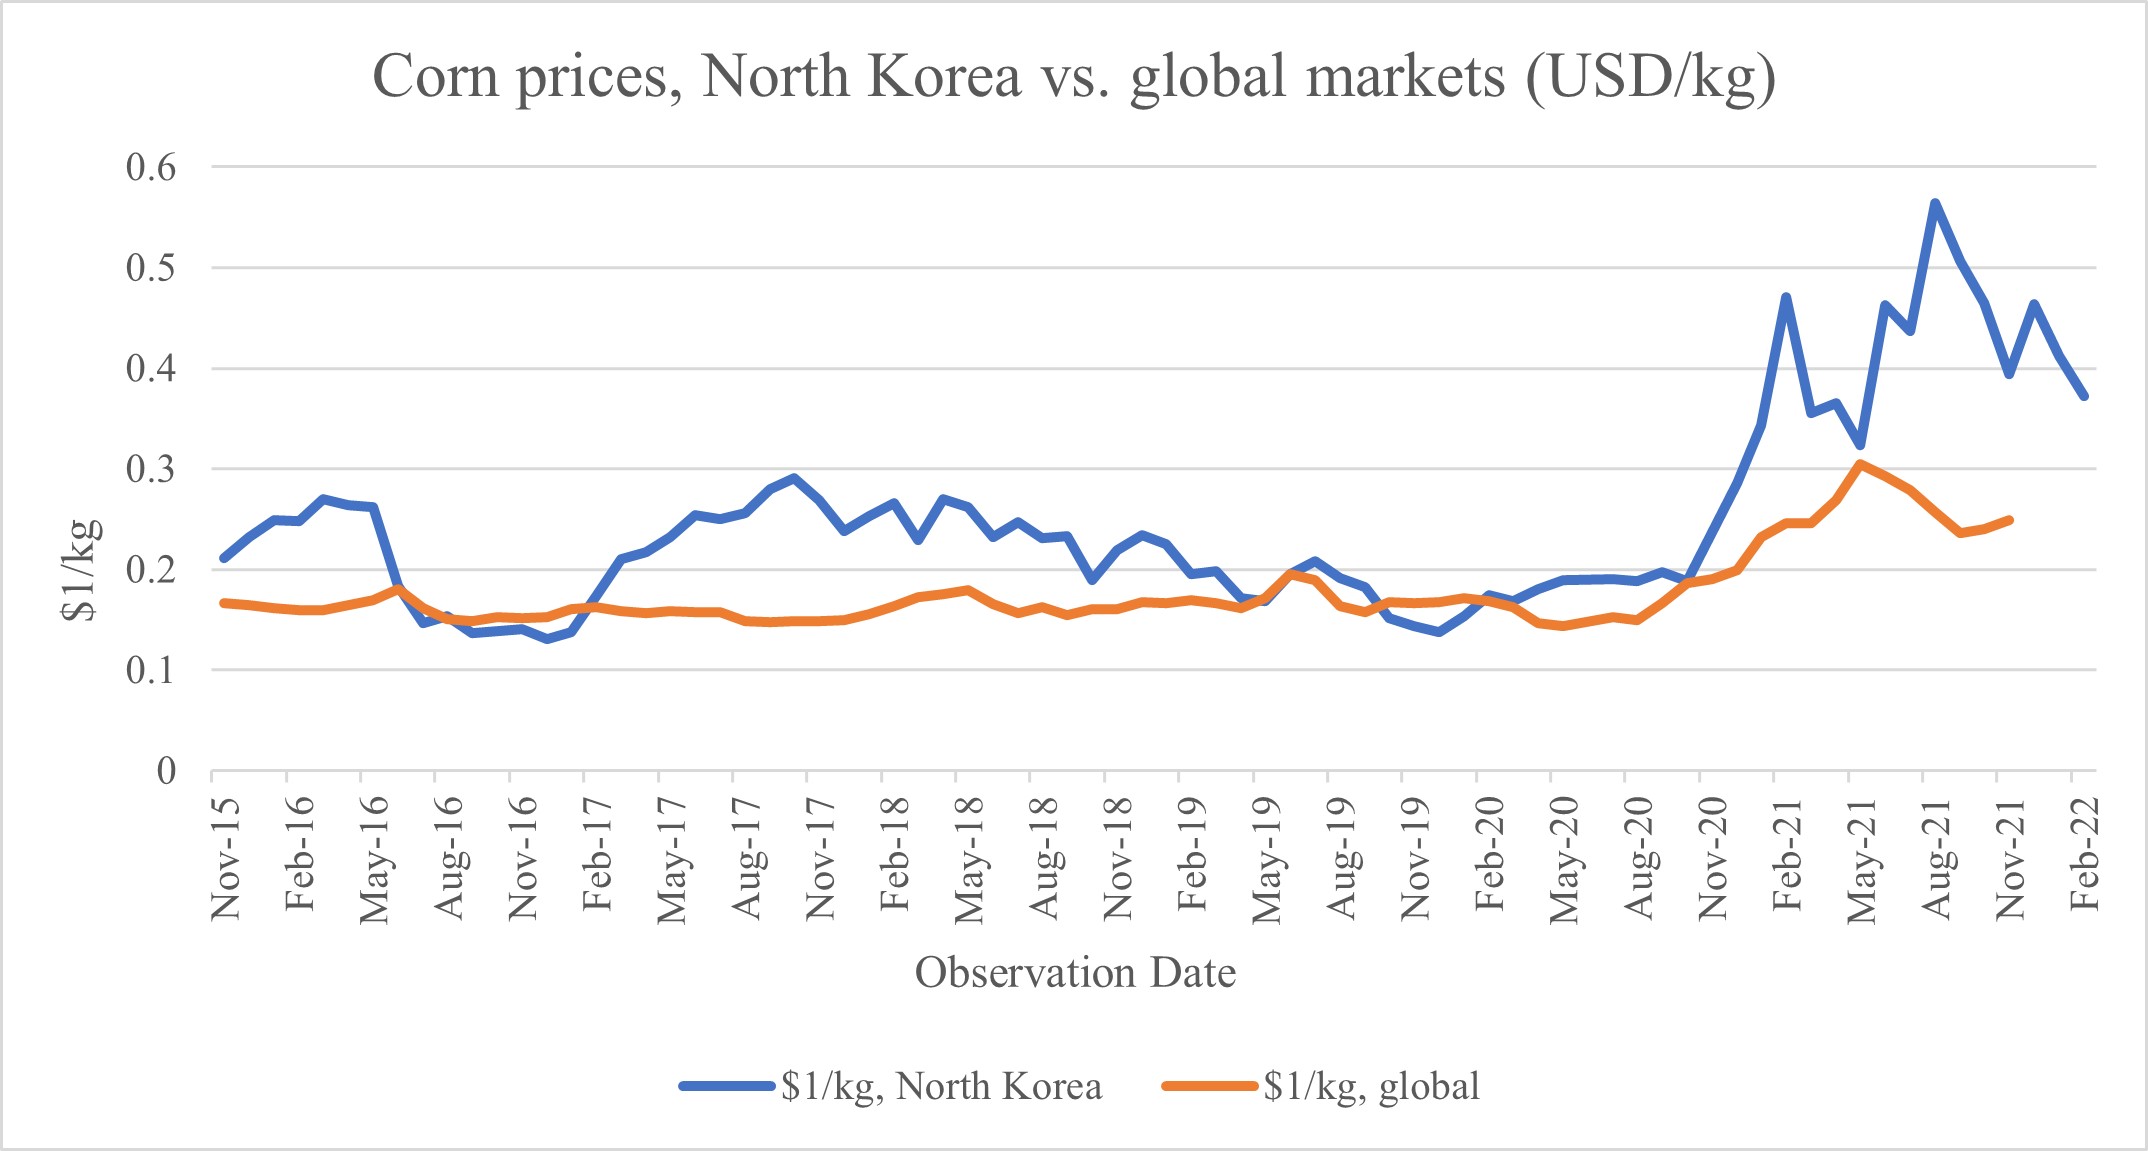
This pattern is similar for corn prices, which are almost consistently higher in North Korea and fluctuate more drastically than on global markets.
Graph 3. Corn prices, North Korea vs. global markets (USD/kg).
Graph 4. Percentage change in corn prices, North Korea vs. gobal markets.
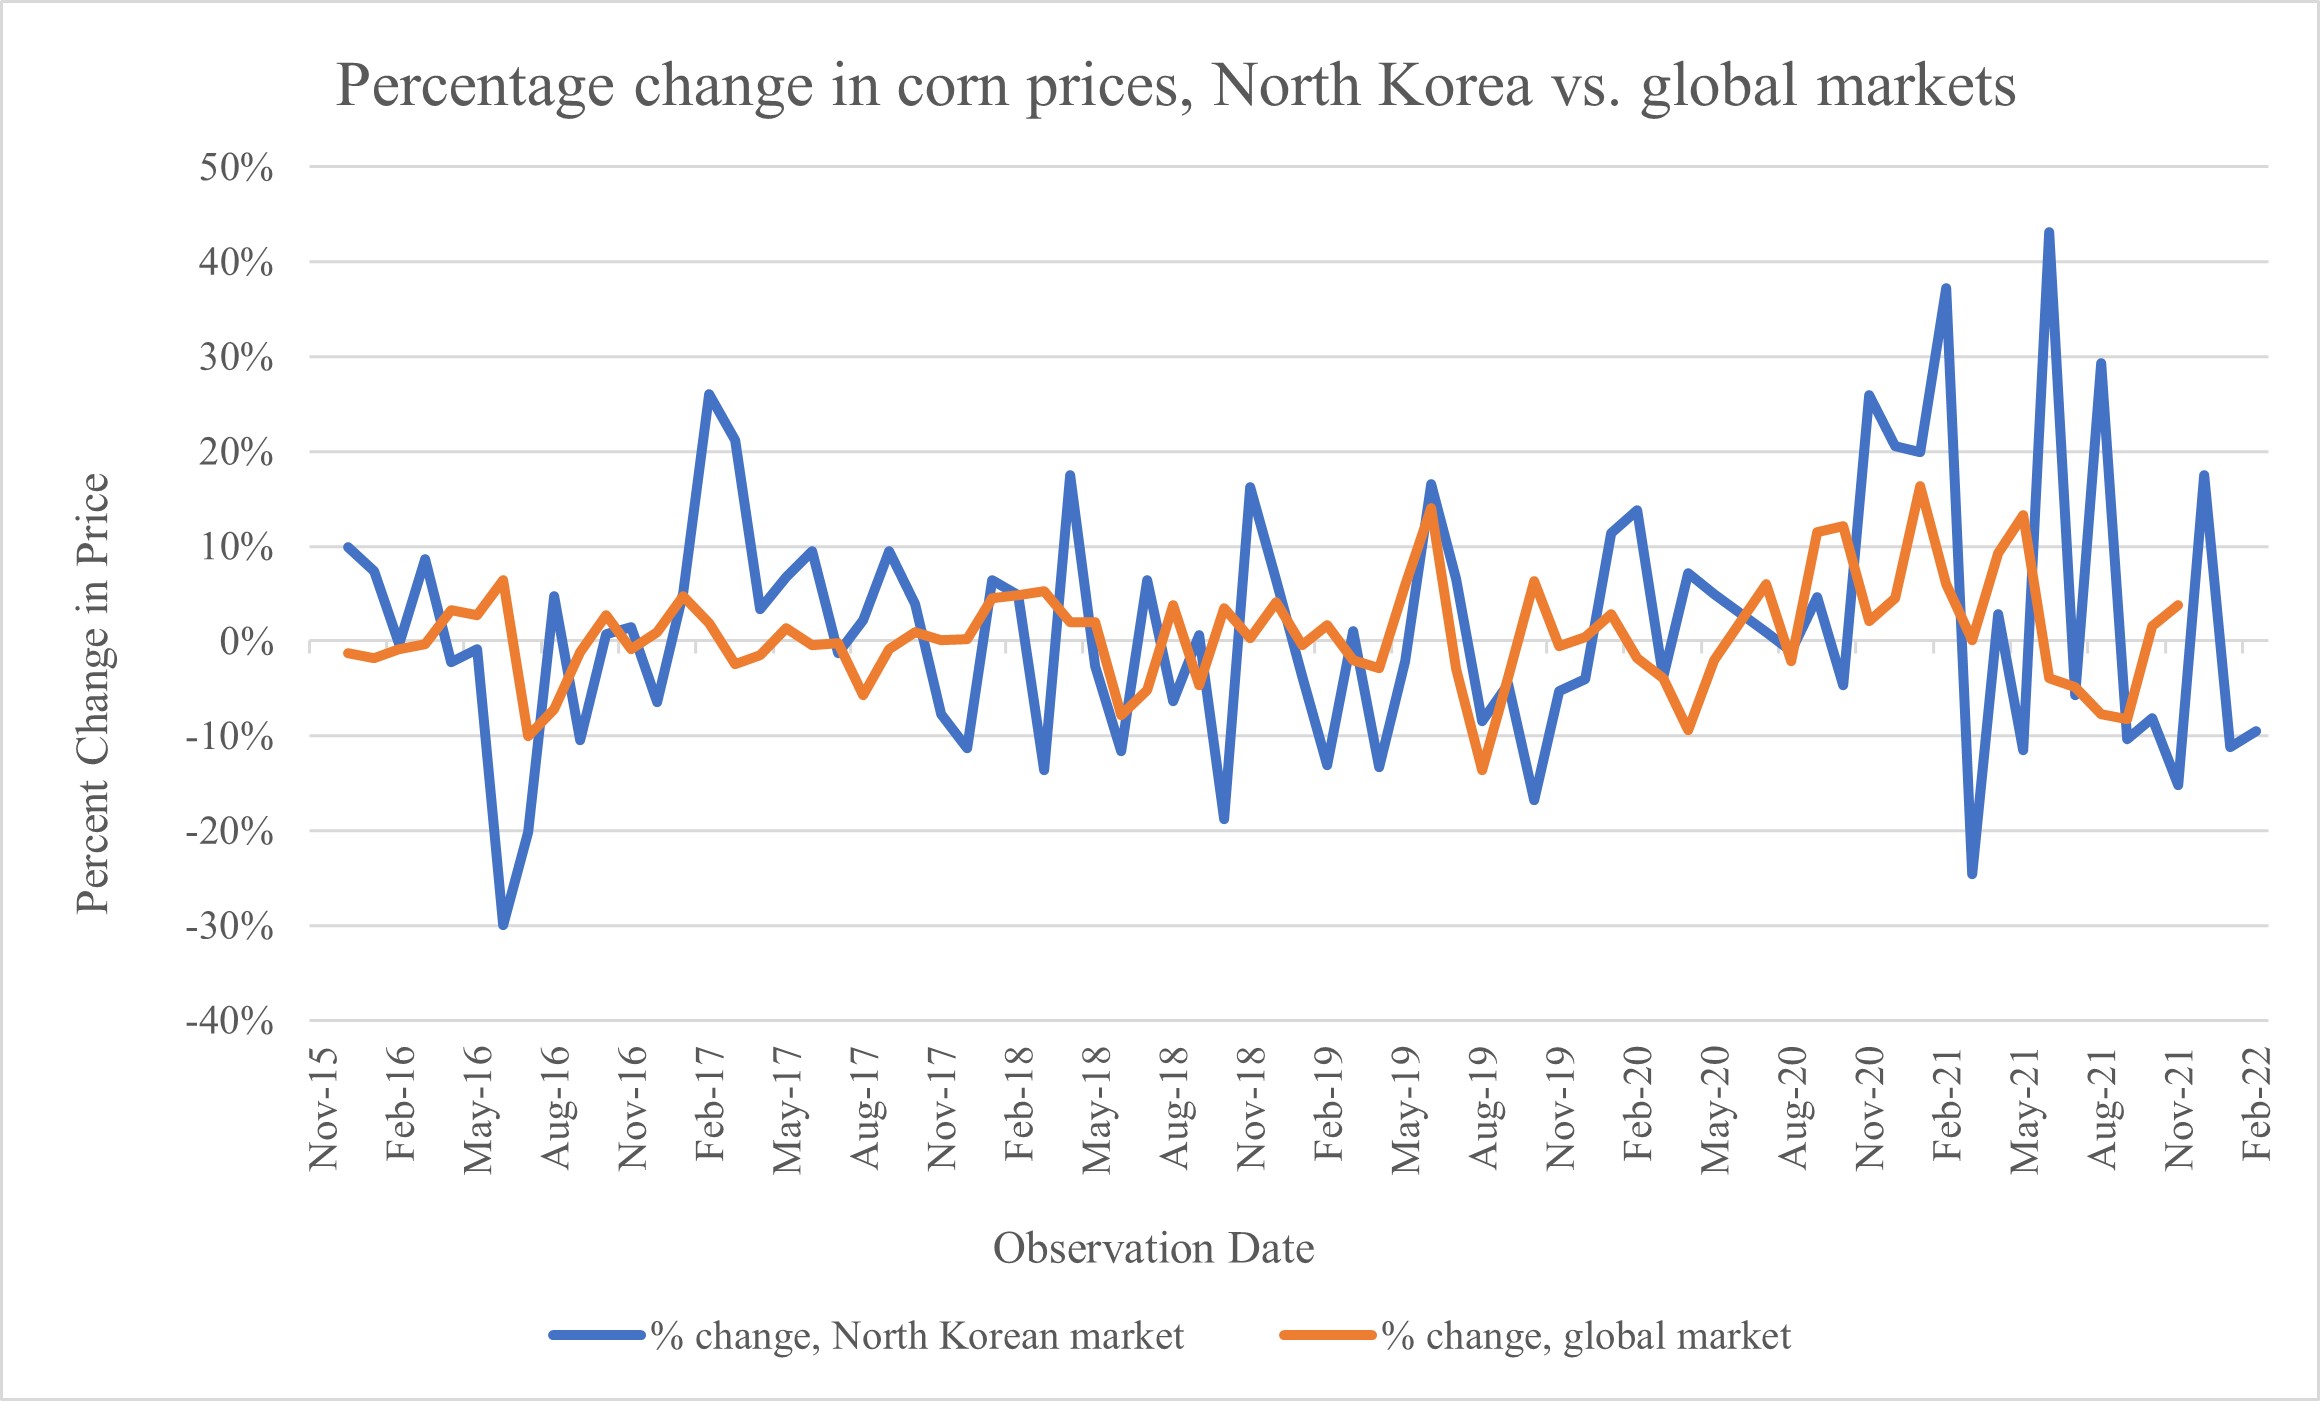
The data both on rice and corn shows that global price movements generally impact food prices in North Korea. At the same time, they can also significantly differ, highlighting the still relatively closed nature of North Korea’s economy. For example, the drastic price rise from November 2020 most likely stemmed from an increase in domestic demand due to food shortages following the country’s COVID-19 border closure.
Oil and Fuel Prices
Gasoline prices appear to be less influenced by global oil prices.
Graph 5. North Korean gas prices vs. global oil prices (USD/kg).
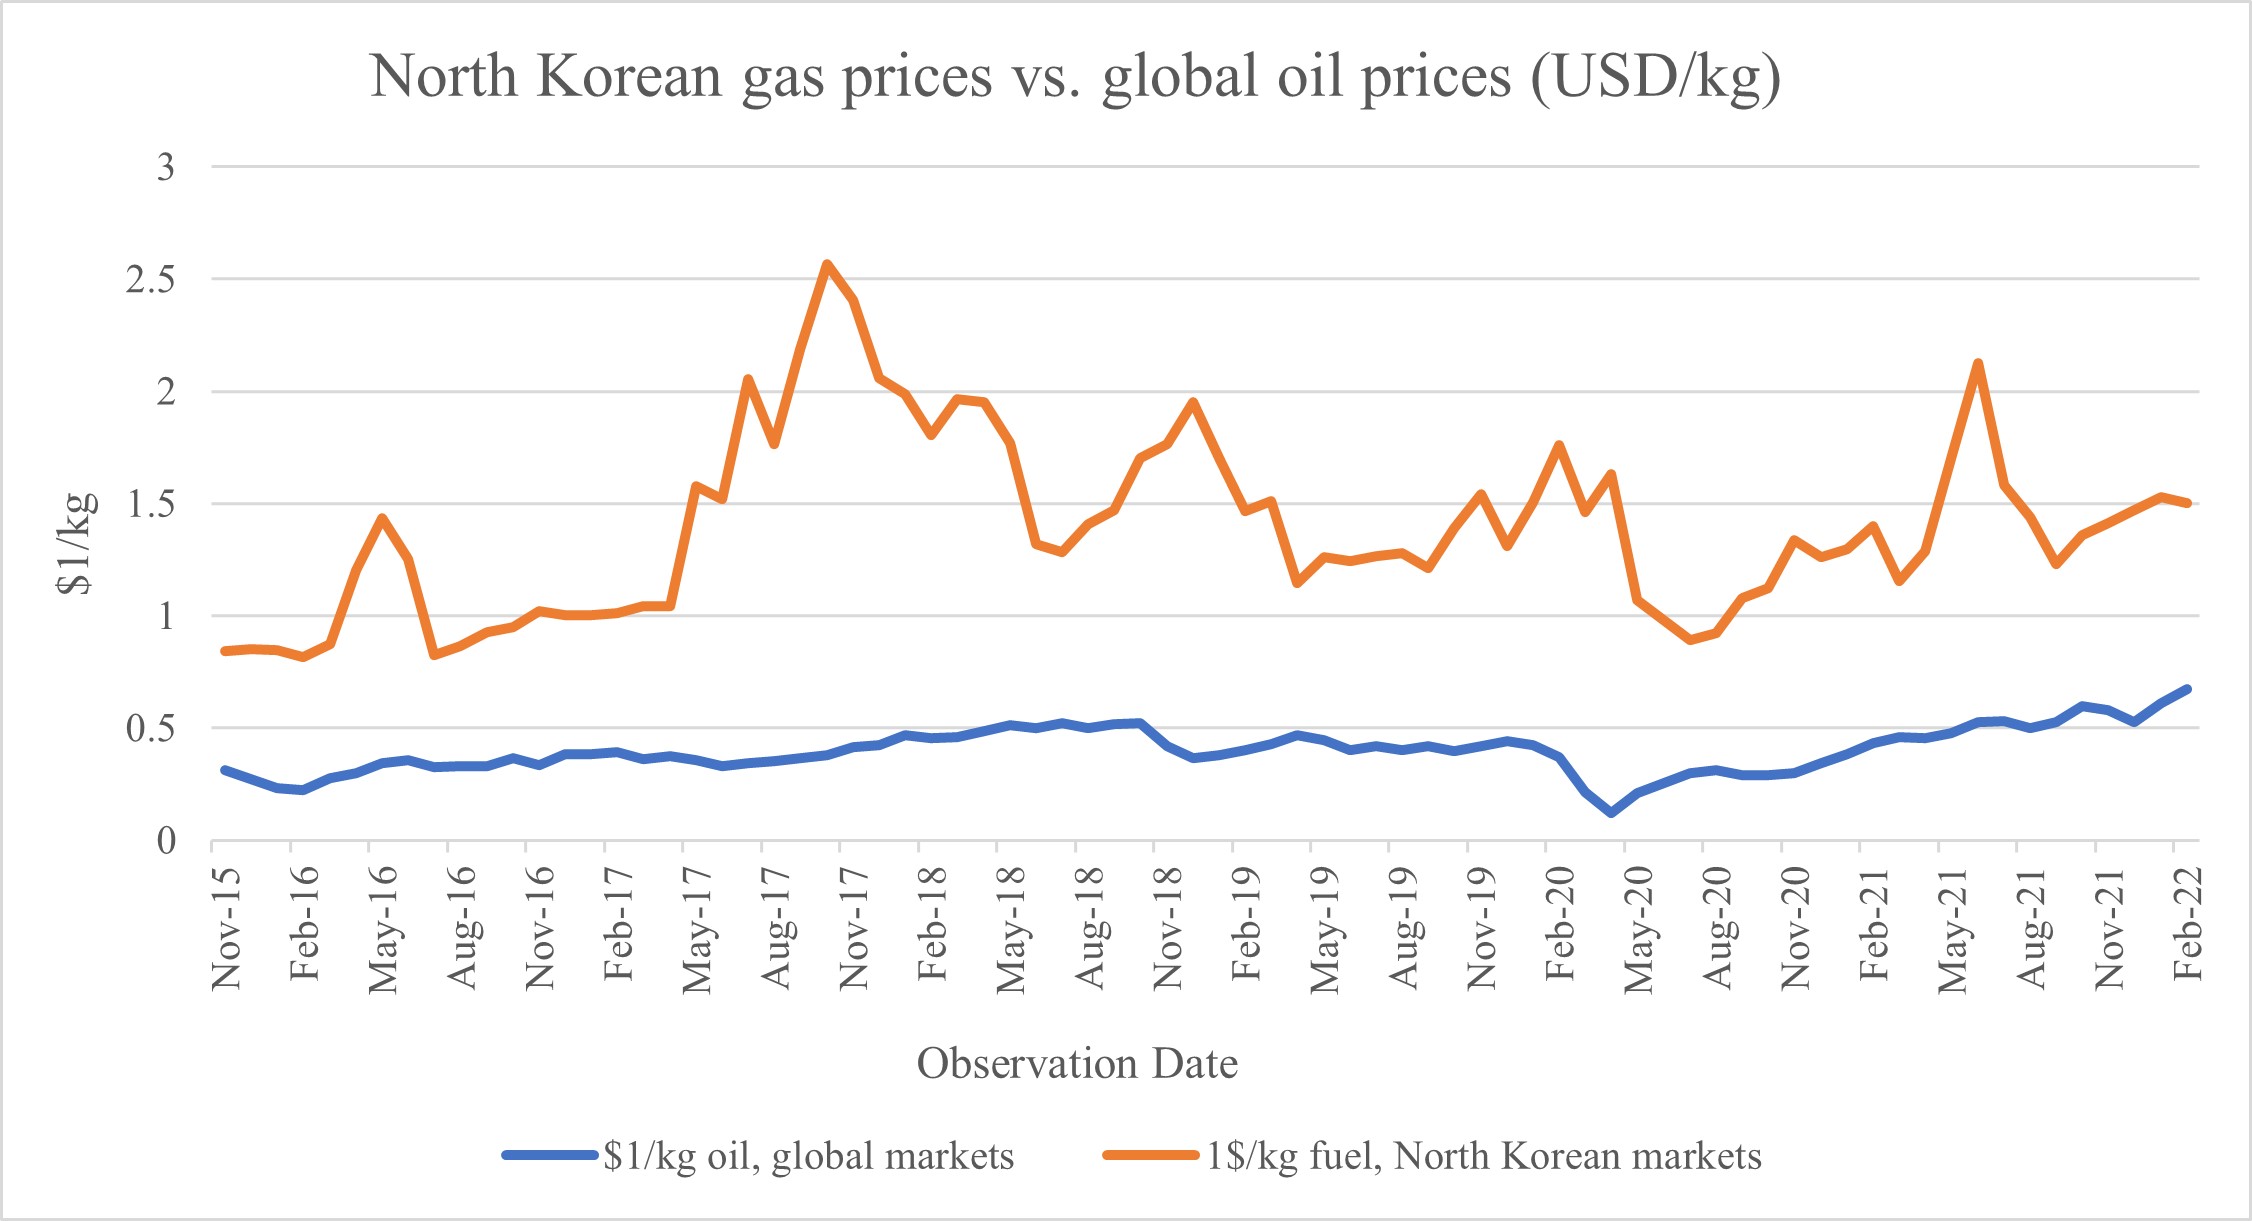
As this comparison above clearly demonstrates, the rate of price changes for oil in North Korea appears to be heavily influenced by other factors other than global price trends.
Graph 6. Percentage change in fuel prices, North Korean gas prices vs. global oil prices.
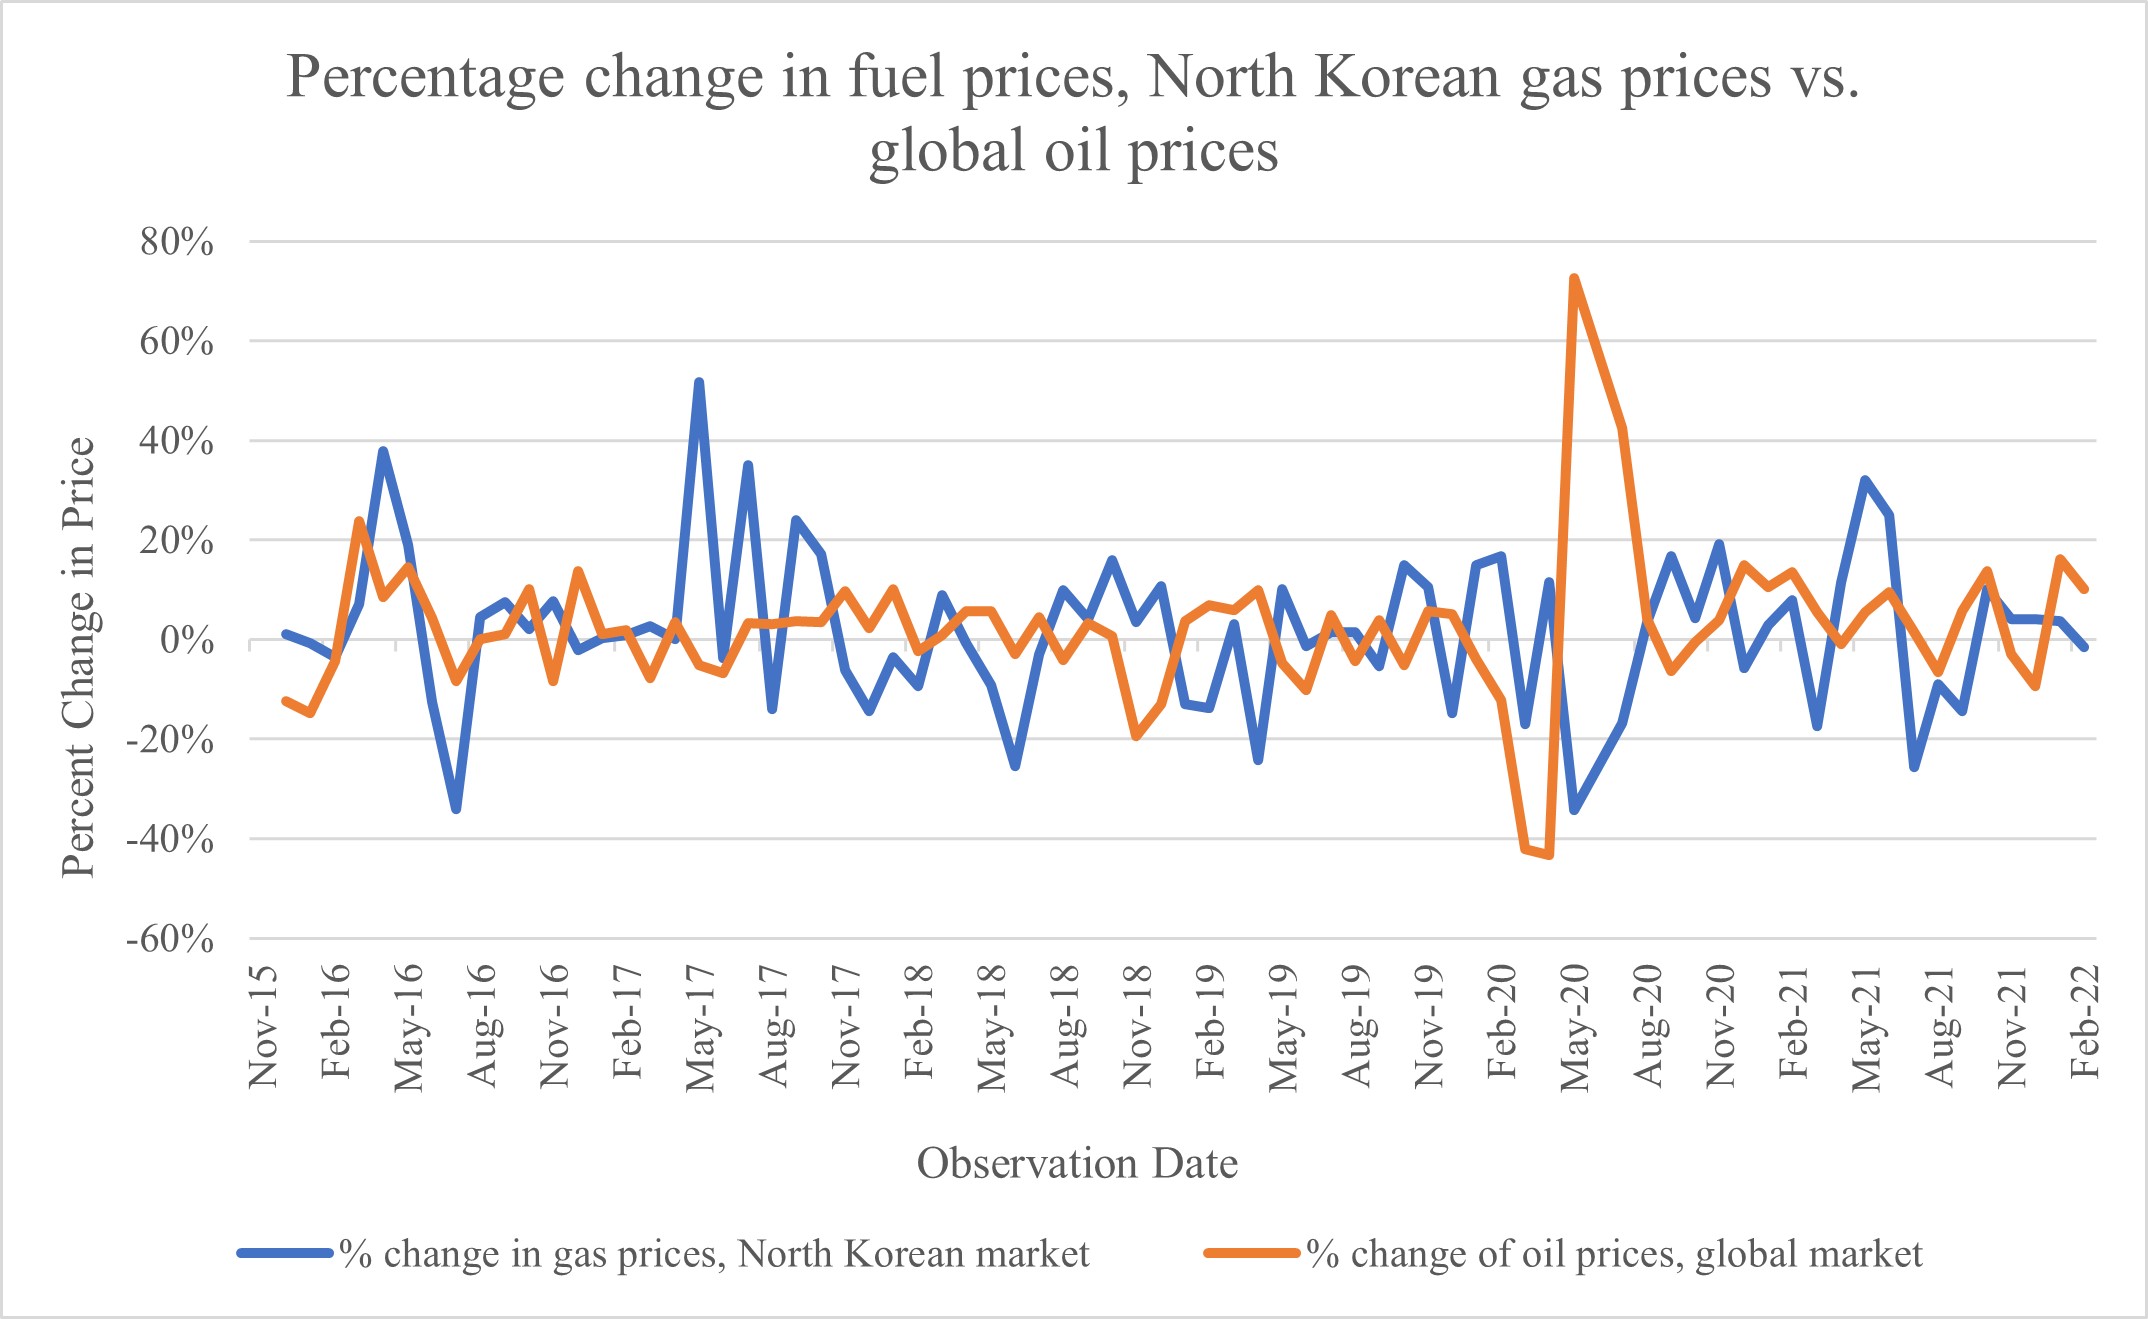
While there may be occasional periods where the global price and North Korean prices move in tandem, such as in the first few months of 2016, this is not usually the case. North Korean gas prices tend to be strongly impacted by the state of North Korea-China relations, as China supplies the overwhelming majority of oil and fuel to North Korea. It is possible that the impact of global oil prices on gas inside North Korea comes exclusively from the share of oil and fuel imports that are private rather than what North Korea receives from China on a non-commercial basis.
Foreign Exchange Rates
Foreign exchange rates are the market prices in North Korea that move in closest tandem with global markets. This is not surprising since the supply of these currencies is entirely controlled by international governments and markets.
Graph 7. Renminbi-US dollar (RMB-USD) exchange rate, North Korean and international markets.
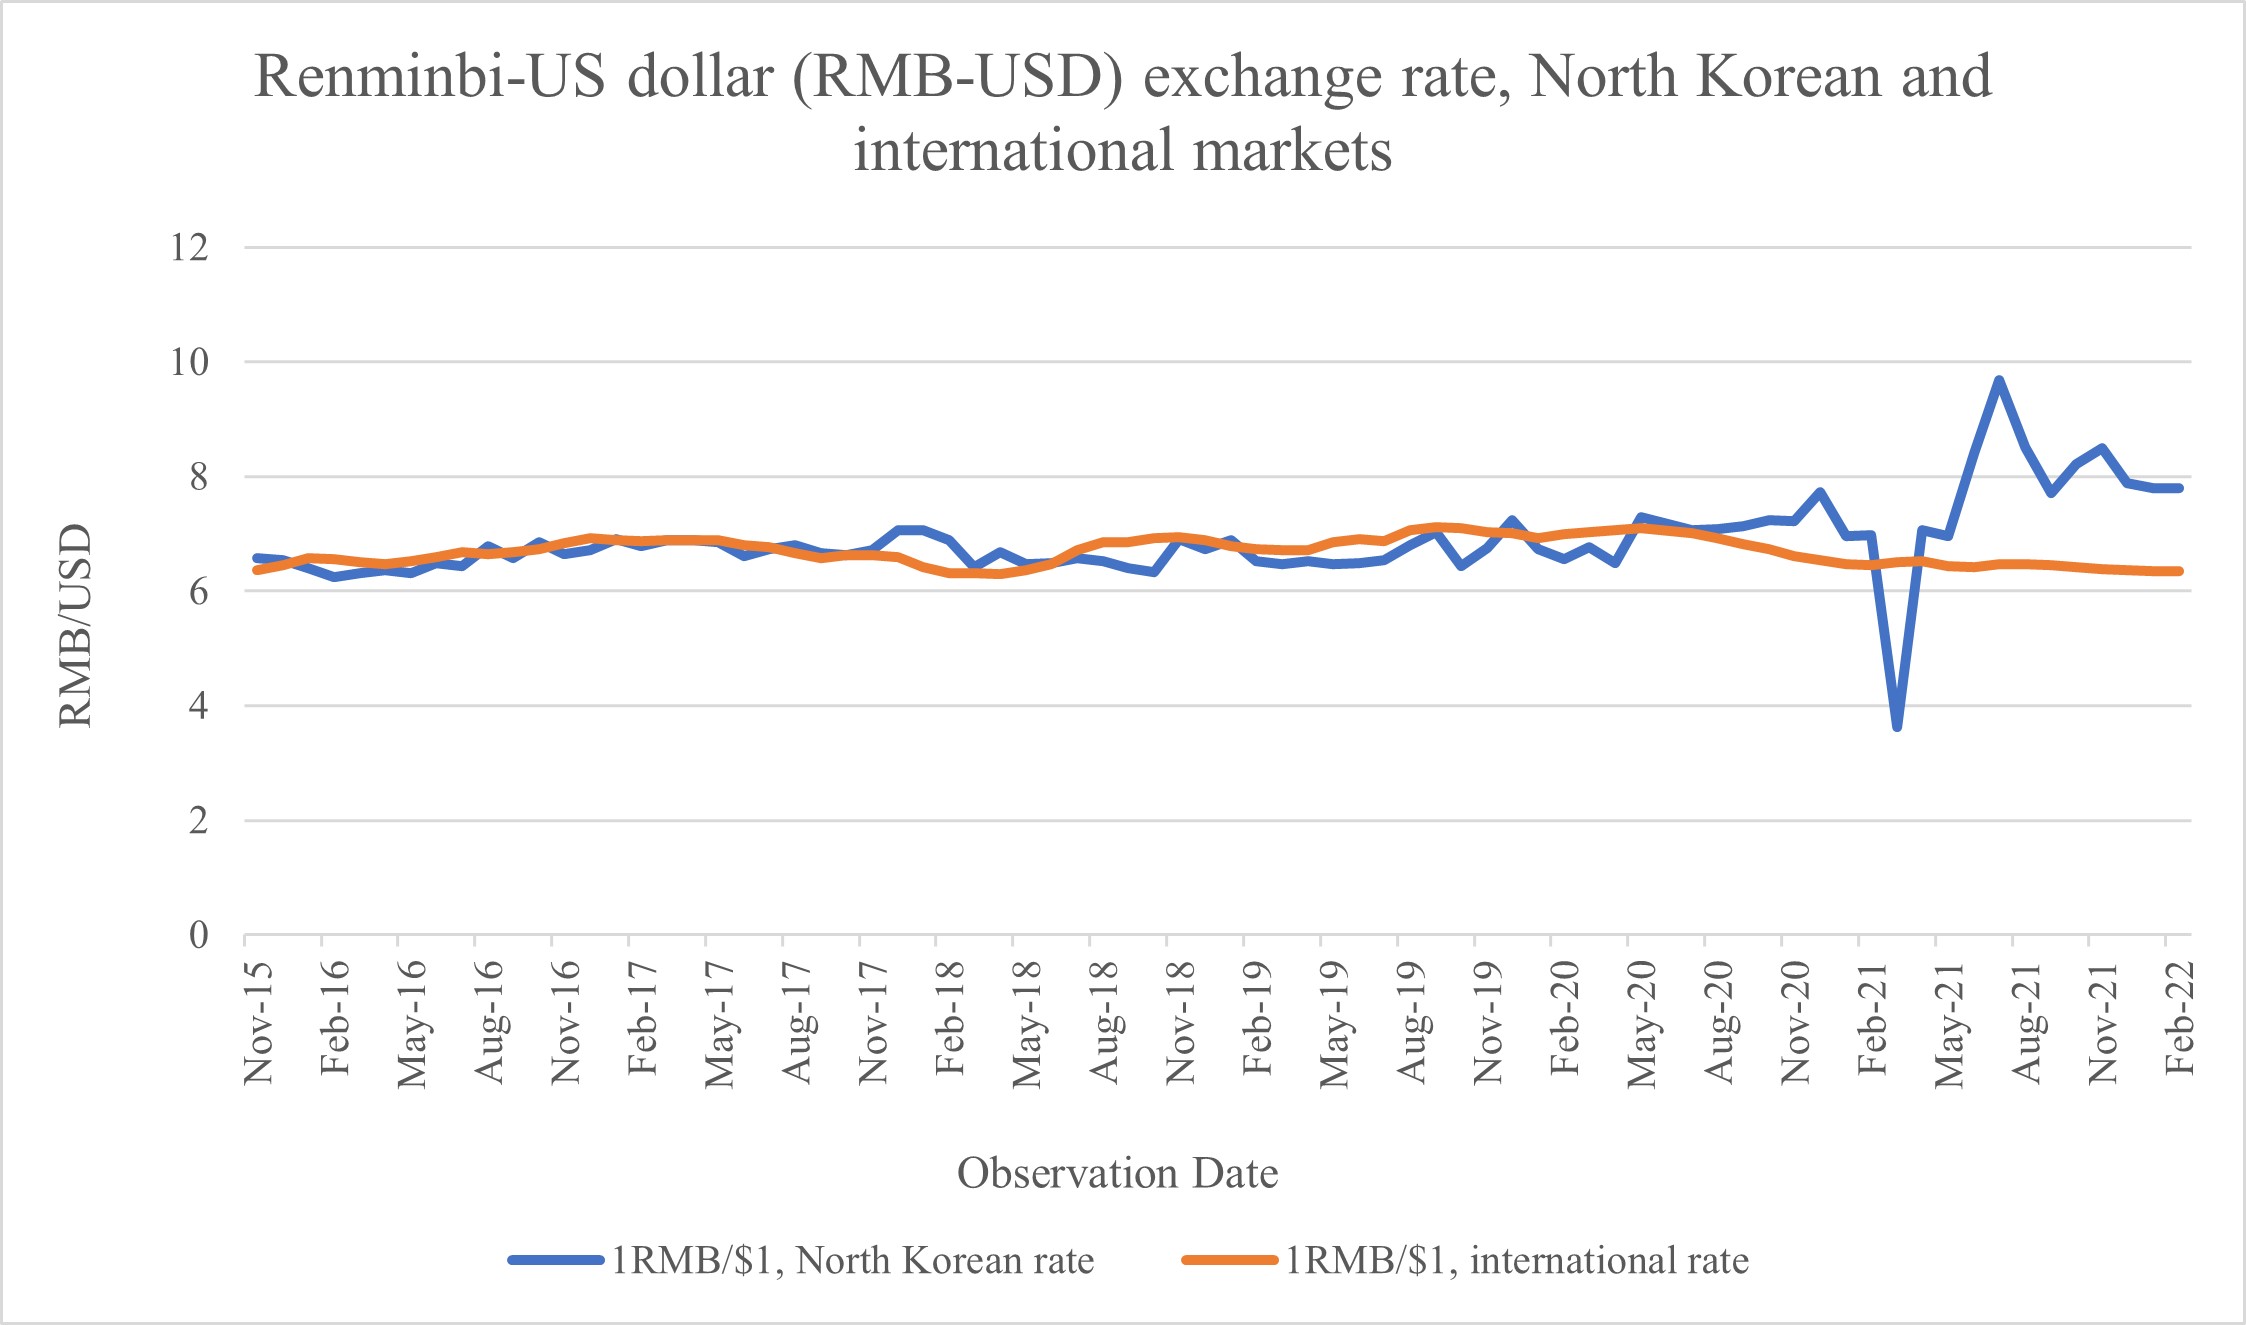
However, as made evident in the graph above (Graph 7), conditions specific to North Korea clearly have a strong impact as well. For example, exchange rates have been lower in North Korea than in the rest of the world for most of the COVID-19 period. This is because foreign currency lost much of its economic utility during the border shutdown. The somewhat higher volatility of exchange rates in North Korea can probably be explained, too, by the lack of trustworthy and adequate market information inside the country.
Conclusion
The North Korean economy may be more internationally disconnected than most, but, as this analysis shows, it is not insulated from global price changes. Through both legal imports and smuggling, price changes on global markets usually find their way to North Korea, too, albeit with some delay. Price fluctuations in North Korea are more volatile than in global markets, which reflects the lack of transparent and easily available information on North Korean markets. Thus, although we cannot specify precisely to what extent, even the supposedly autarkic North Korean economy is solidly connected to the rest of the world.
- [1]
When using price data from North Korea to study complex issues, a caveat is necessary. I use data from the Daily NK’s market price index, which uses information from sources inside North Korea that cannot be verified. Moreover, I compare the average of price data observations for each month with monthly global price data. Since data for domestic prices in North Korea and global prices are not reported in the same time format, there may be some irregularities.