The Nuclear Option
Continued from:
“THAAD: What It Can and Can’t Do”
Continued from “THAAD: What It Can and Can’t Do“
No missile defense system or architecture will be “leak proof.” Rather, missile defenses are designed to reduce the number of missiles striking critical targets, much in the way air defenses retard attacks by an enemy’s air forces. If North Korea fires conventionally-armed missiles, a low leakage rate is acceptable since the damage caused will be manageable. However, missiles equipped with nuclear warheads are another matter entirely. Even if only one penetrates the defenses the death and damage would be immense. In this context, the addition of THAAD, or any other missile-defense system will not guarantee that South Korea is immune to Pyongyang’s nuclear-armed missiles.
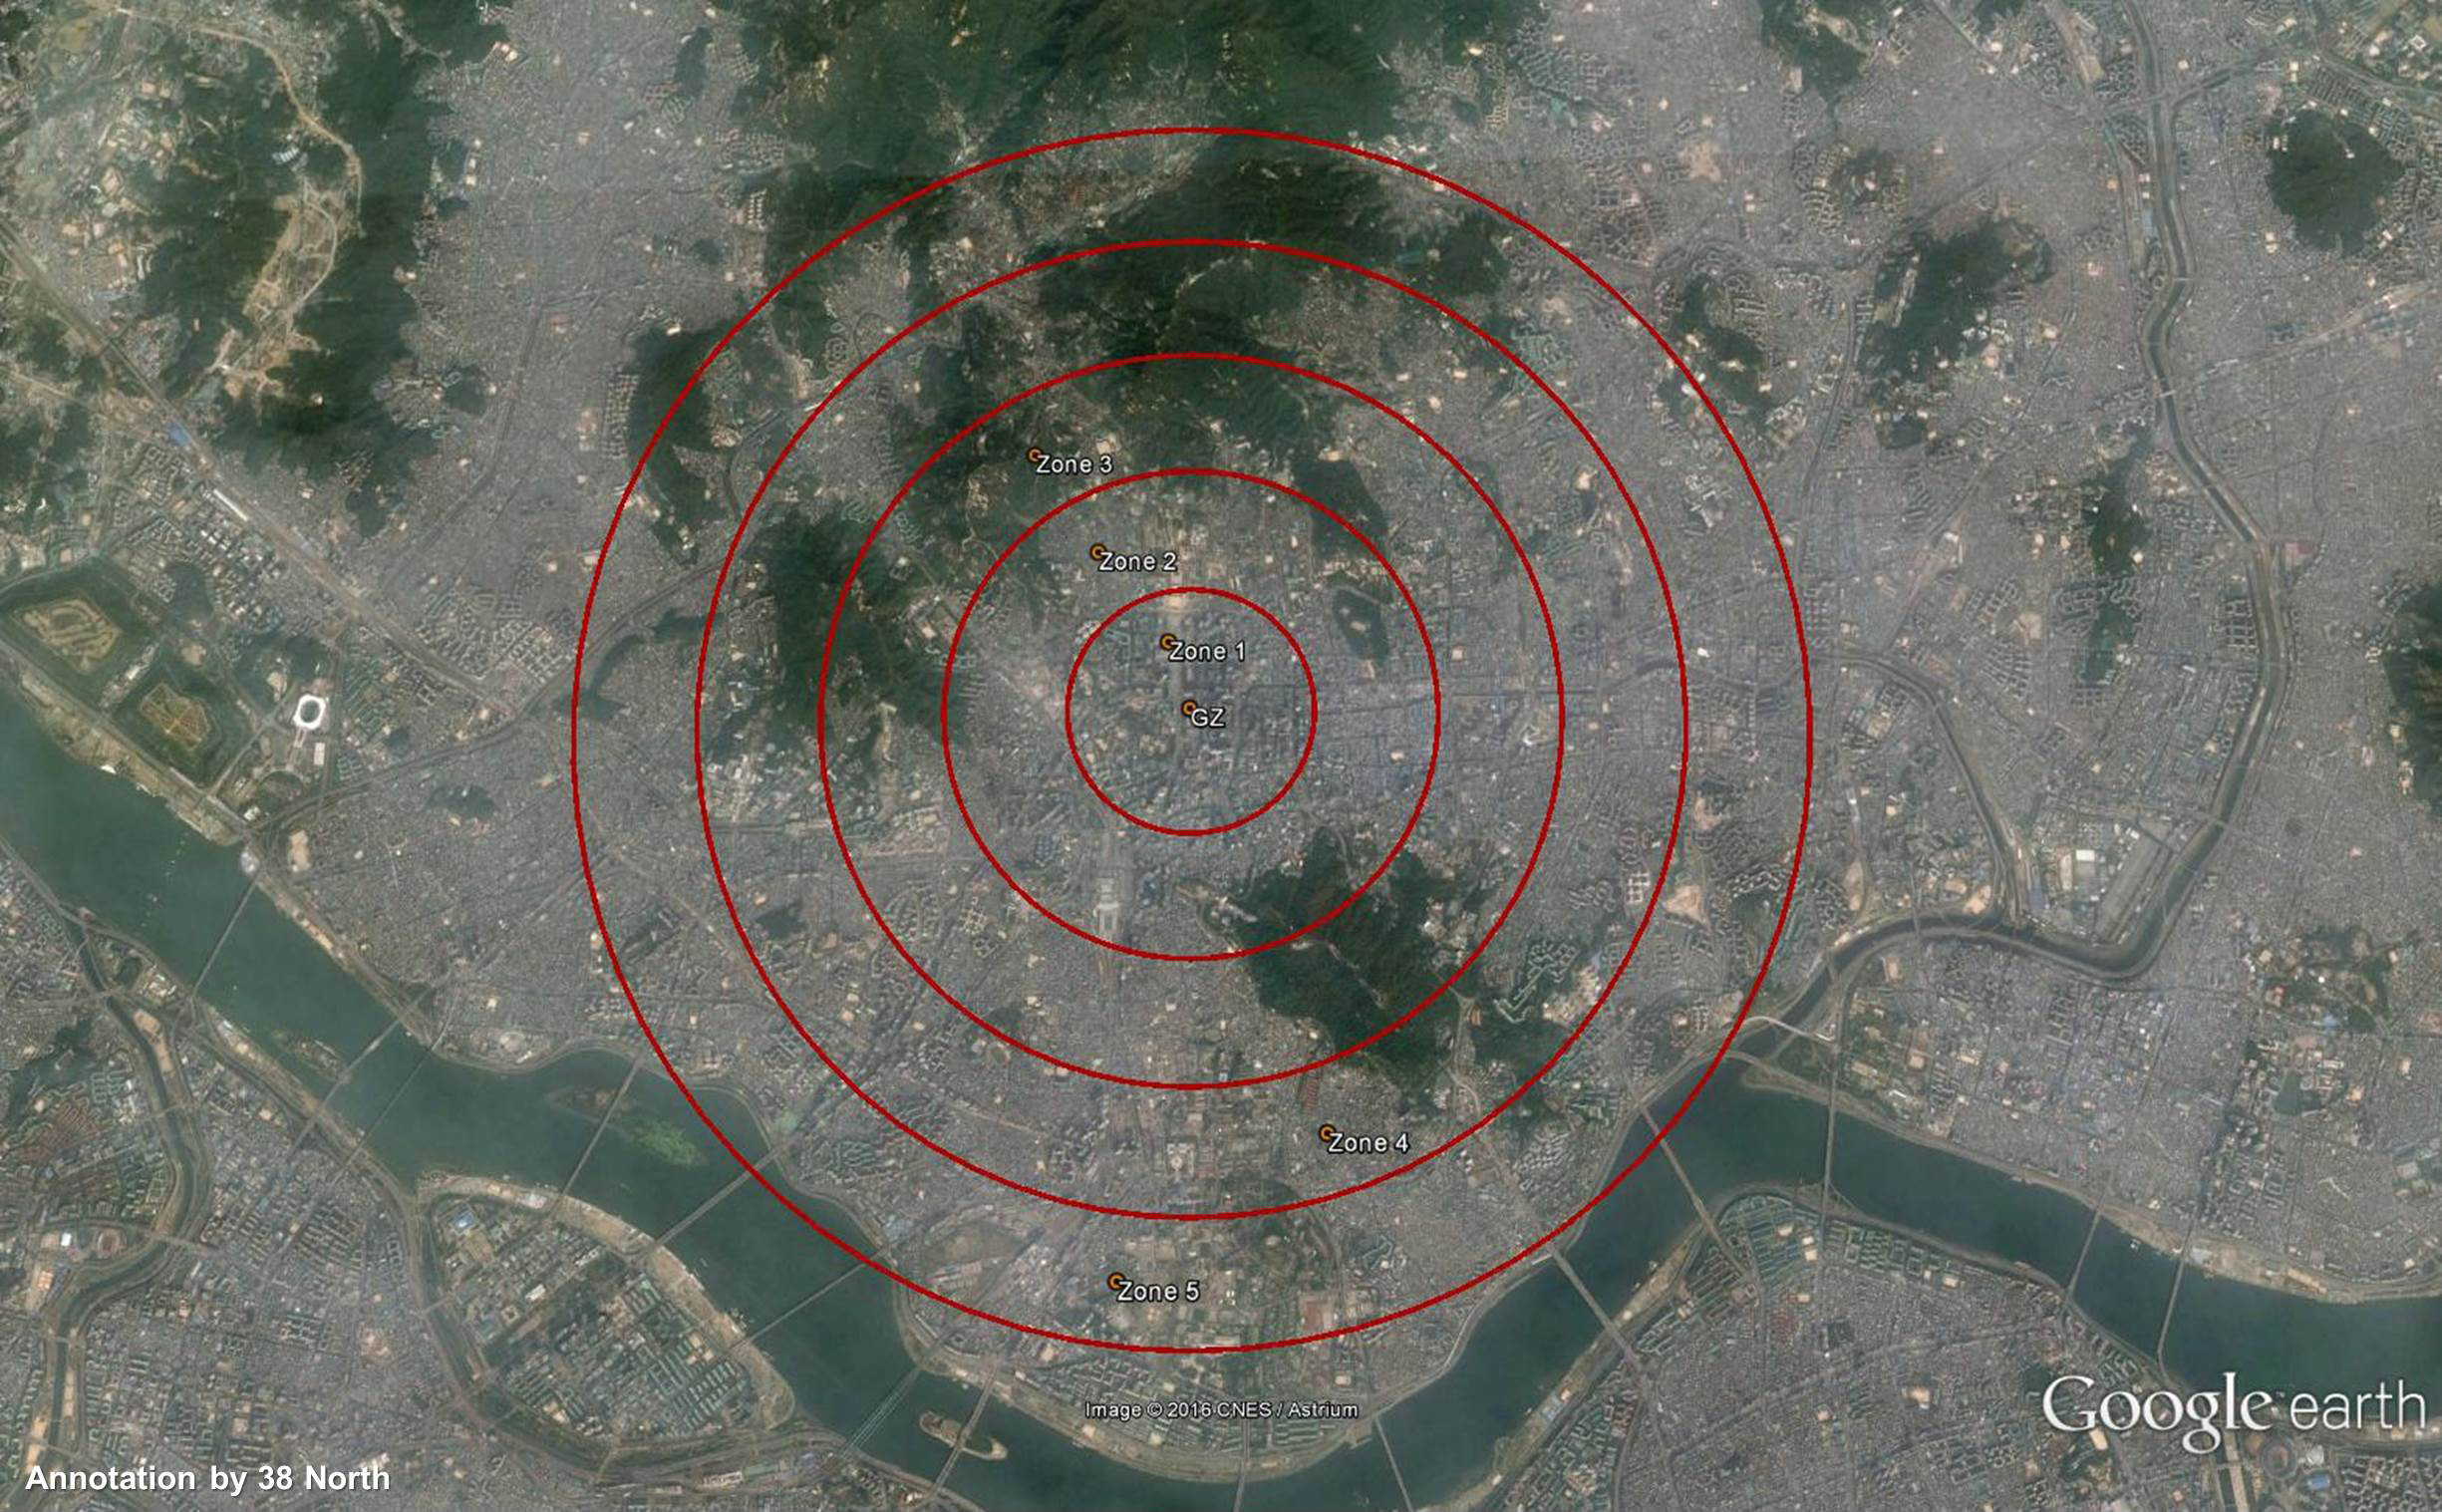
To better understand to catastrophic damage caused by a nuclear bomb, let’s assume that one missile with a nuclear warhead beats THAAD and lands on Seoul. A 20 kiloton warhead would result in casualties extending up to 5 km. from the point of detonation. The data in the following table shows the casualties in each of the five rings/zones shown in the Google Earth satellite image below plus the total casualties in comparison with the total population of Seoul proper.
Figure 4a-b. Estimated casualties per zone from one nuclear-armed missile.
| 20 kt Airburst | ||||
| Ring/Zone | km from GZ | Fatalities | Injuries | Total |
| 1 | 1 km | 46,885 | 4,743 | 51,628 |
| 2 | 2 km | 63,281 | 62,061 | 125,342 |
| 3 | 3 km | 20,868 | 105,152 | 126,020 |
| 4 | 4 km | 0 | 87,265 | 87,265 |
| 5 | 5 km | 0 | 29,269 | 29,269 |
| 131,034 | 288,491 | 419,525 | ||
| % of Pop. | 1.25% | 2.76% | 4.02% | |
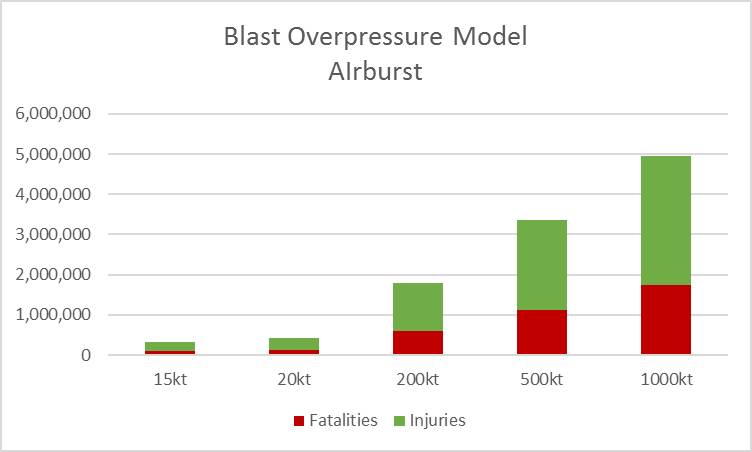
The following are estimates for casualties from different weapon yields ranging from 15kt to 1000kt (1mt) using the same model.
Figure 5a-b. Estimated casualties per different weapon yields.
| Overpressure Model, Airburst Detonation | ||||
| Weapon Yield | Fatalities | Injuries | Total | % of Population (Seoul) |
| 15kt | 110,843 | 225,345 | 336,189 | 3.22% |
| 20kt | 131,034 | 288,491 | 419,525 | 4.02% |
| 200kt | 595,682 | 1,204,914 | 1,800,595 | 17.24% |
| 500kt | 1,127,947 | 2,236,652 | 3,364,598 | 32.22% |
| 1000kt | 1,751,136 | 3,213,095 | 4,964,230 | 47.54% |
Return to last section: Some Significant Caveats
Next section: Conclusion